
Private real estate 101

Key Takeaways

Commercial Real Estate

Primary Strategies

Main Drivers
What is commercial real estate?
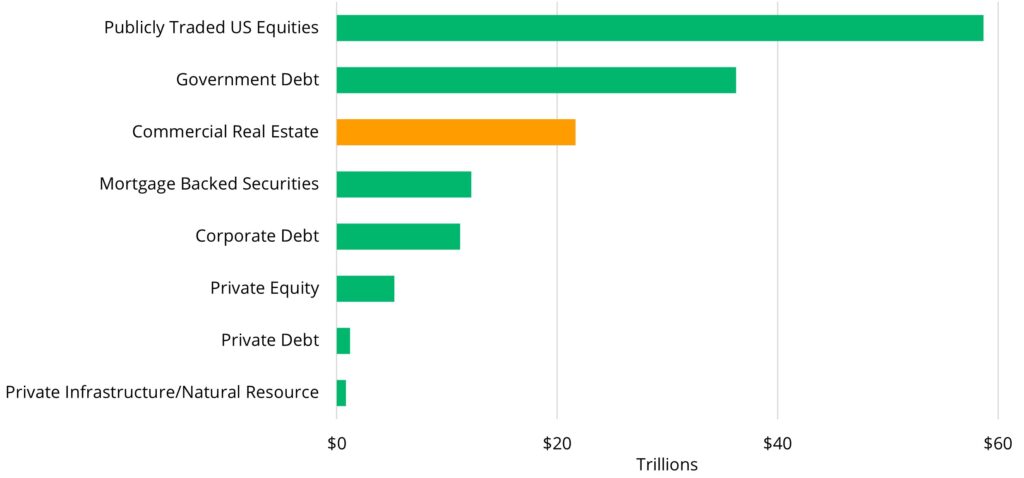
Commercial Real Estate Ranks as the Third Largest Asset Class in the USii
Major CRE Sectors
Rental residential broadly includes any form of housing that is not owner-occupied, including apartments, low-density, and single-family rentals, Seniors housing, and student housing.
Industrial encompasses manufacturing facilities as well as warehouses and distribution centers that store physical goods.
Office buildings house firms and workers who are primarily engaged in services activities, such as administration, management, finance, and information.
Retail refers to physical (or “brick and mortar”) stores, which could take various formats, such as malls, neighborhood shopping centers, restaurants, and convenience stores.
Hospitality refers to the hotels, resorts, and similar locations that offer overnight lodging.
Primary CRE Investment Strategies
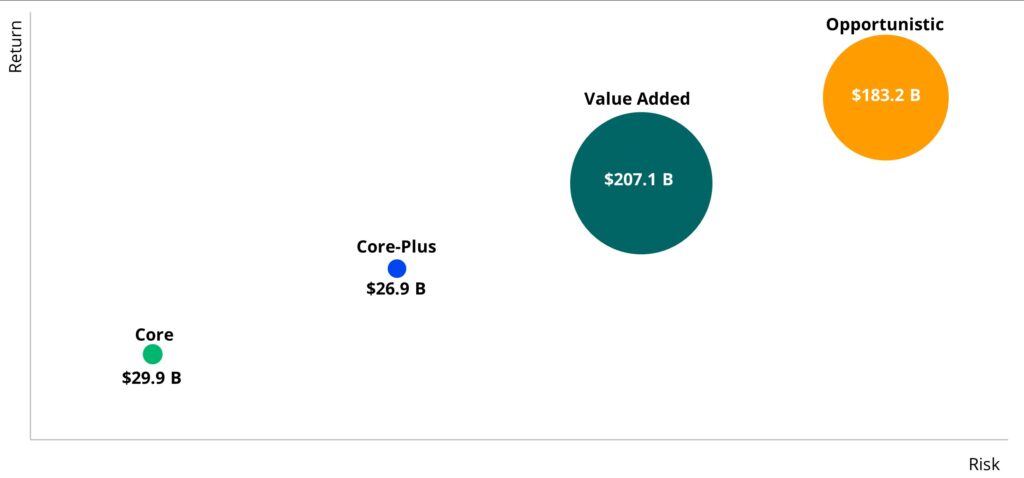
Private CRE Fundraising Over the Past Five Years Was Heavily Concentrated in Value-Added and Opportunistic Strategiesiii
Private CRE as an Asset Class
CRE managed by private investment managers provides investors with exposure to real assets, typically compiled in a fund or a private REIT that own or intend to acquire large portfolios of single-sector or diversified property types. Investment managers specialize in real estate management and oversee day-to-day asset management on behalf of their investors.
Public CRE investment vehicles are traded on stock exchanges and offer liquidity just as any other publicly traded security. Investors may note that Public CRE securities can be influenced by swings in broader market sentiment. In Private CRE, there are typically longer-duration commitment periods, and investors may expect higher potential returns as a ‘liquidity premium’ as a trade-off for liquidity.
Private CRE is a dominant form of investment in real assets as Public CRE accounts for less than 10% of the CRE transaction market.iv
Private real estate has an established track record of delivering investment returns through business cycles as highlighted below.
Private CRE Has Recorded Low Correlations with Stocks and Bonds Since 2000v
|
Private CRE |
Public CRE |
Stocks |
|
|---|---|---|---|
|
Public CRE |
0.18 |
||
|
Stocks |
0.04 |
0.70 |
|
|
Bonds |
-0.14 |
0.24 |
-0.09 |
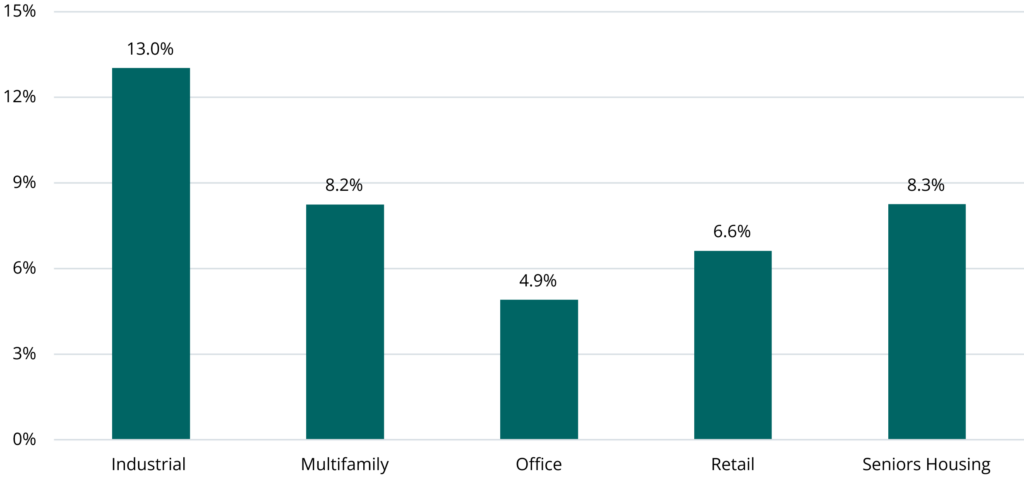
Private CRE has Delivered Healthy Annual Returns over the Past 15 Yearsvi
Explore Private Markets Further
Explore select private market asset classes to understand better what they are, who uses them, and the potential to identify value.

Explore Private Real Estate Asset Classes
Explore select private market asset classes to understand better what they are, who uses them, and the potential to identify value.


The information herein is provided for educational purposes only and should not be construed as financial or investment advice, nor should any information in this document be relied on when making an investment decision. Opinions and views expressed reflect the current opinions and views of the author(s) and Bridge Analysts as of the date hereof and are subject to change at any time without notice. Please see the end of this document for important disclosure information.
Important Disclosure Information
This material is for educational purposes only and should not be treated as research. This material may not be distributed, transmitted or otherwise communicated to others, in whole or in part, without the express written consent of Bridge Investment Group Holdings LLC (together with its affiliates, “Bridge”).
The views and opinions expressed in this material are the views and opinions of the author(s) of the material. They do not necessarily reflect the views and opinions of Bridge and are subject to change at any time without notice. Further, Bridge and its affiliates may have positions (long or short) or engage in securities transactions that are not consistent with the information and views expressed in this material. There can be no assurance that an investment strategy will be successful. Historic market trends are not reliable indicators of actual future market behavior or future performance of any particular investment which may differ materially and should not be relied upon as such. Target allocations contained herein are subject to change. There is no assurance that the target allocations will be achieved, and actual allocations may be significantly different than that shown here.
This material does not constitute an offer of any service or product of Bridge. It is not an invitation by or on behalf of Bridge to any person to buy or sell any security or to adopt any investment strategy, and shall not form the basis of, nor may it accompany nor form part of, any right or contract to buy or sell any security or to adopt any investment strategy. Nothing herein should be taken as investment advice or a recommendation to enter into any transaction.
Hyperlinks to third-party websites in this material are provided for reader convenience only. Unless otherwise noted, information included herein is presented as of the dates indicated. This material is not complete, and the information contained herein may change at any time without notice. Bridge does not have any responsibility to update the material to account for such changes. Bridge has not made any representation or warranty, expressed or implied, with respect to fairness, correctness, accuracy, reasonableness, or completeness of any of the information contained herein, and expressly disclaims any responsibility or liability, therefore. The information contained herein is not intended to provide, and should not be relied upon for, accounting, legal or tax advice or investment recommendations. Investors should make an independent investigation of the information contained herein, including consulting their tax, legal, accounting or other advisors about such information. Bridge does not act for you and is not responsible for providing you with the protections afforded to its clients.
Certain information contained herein may be “forward-looking” in nature. Due to various risks and uncertainties, actual events or results may differ materially from those reflected or contemplated in such forward-looking information. As such, undue reliance should not be placed on such information. Forward-looking statements may be identified by the use of terminology including, but not limited to, “may”, “will”, “should”, “expect”, “anticipate”, “target”, “project”, “estimate”, “intend”, “continue” or “believe” or the negatives thereof or other variations thereon or comparable terminology. Any reference to indices, benchmarks, or other measure of relative market performance over a specified period of time are provided for context and for your information only.
Past performance is not necessarily indicative of future results.
Additional information may be available upon request.
© 2025 Bridge Investment Group Holdings LLC. “Bridge Investment Group” and certain logos contained herein are trademarks owned by Bridge.
ATLWAA-20251007-4860464-15364537
i Federal Reserve System, Financial Stability Report, as of April 2025.
ii US Treasury Fiscal Data, What is The National Debt?, as of May 12, 2025. SIFM, US Corporate Bond Statistics, as of May 1, 2025. SIFMA, US Mortgage-Backed Securities Statistics, January 8, 2024. Federal Reserve System, Financial Stability Report, as of April 2025. SIFMA, Research Quarterly: Equities, as of April 16, 2025. Preqin, as of September 2024.
iii Preqin, as of April 14, 2025. Data period is 2020-2024.
iv MSCI Real Capital Analytics, Standardized Downloads, as of Q1 2025. Calculated over the past five years.
v NCREIF, NPI Returns, as of Q1 2025. Nareit, All REITs Index, as of March 31, 2025. S&P 500 Index, as of March 31, 2025. Bloomberg, Bloomberg Aggregate Bond Index, as of March 31, 2025. Calculations based on quarterly returns.
vi NCREIF NPI Gross Unlevered Returns, as of Q1 2025.
ON THIS PAGE...