

Ahead of the FOMC: Can the Fed Justify a Cut Under Its Dual Mandate?
Executive Summary
- Markets expect the start of an easing cycle at this week’s FOMC meeting. The policy challenge is explaining why policy easing is consistent with the Fed’s dual mandate—maximum employment and price stability—when inflation has not yet returned to the 2% PCE goal.
- Inflation progress has become more uneven. Shelter components are decelerating, but non-shelter core measures have firmed modestly since mid-last year, complicating the case for cuts framed purely as relief from “sticky shelter readings.”
- The labor market has cooled from 2021–2023 peaks but remains resilient: unemployment (U-3) is still low by historical standards, broader under-employment (U-6) is contained, and reduced churn (lower quits and hires) may suggest normalization rather than deterioration. Recent BLS revisions show job growth over the past two years was slower than initially reported, yet hiring over the past year is still above Fed economists’ estimated breakeven levels.
- Market signals are mixed. A higher long end of the Treasury curve suggests lingering inflation risk or rebuilding term premium, while a re-steepened 2s/10s curve tempers hard-landing fears.
- Key risk now in focus: a form of stagflation-lite—slower growth alongside sticky non-shelter inflation. The Fed must thread the needle: acknowledge disinflation fatigue without loosening financial conditions so much that inflation re-accelerates.
What Is the Fed’s Dual Mandate
“The Federal Reserve works to promote a strong U.S. economy. Specifically, Congress has assigned the Fed to conduct the nation’s monetary policy to support the goals of maximum employment and stable prices. Those two goals are often referred to as the Fed’s ‘dual mandate.” i
Policy Backdrop: The Fed’s Mandate and the Target
When the Fed meets this week, markets expect the beginning of a rate cut cycle. The challenge for the Fed, however, will be how to articulate a meaningful policy shift in the context of their dual mandate. In our view, it will be a difficult case to make, and a cut is likely to be framed as managing the balance of risks with greater weight assigned to potential labor market deterioration.
By mandate, the Fed has two objectives in conducting monetary policy: promote maximum employment and price stability. The latter is more clearly defined as a long-term inflation rate of 2 percent as measured by the annual change in PCE.ii
The problem is that inflation has not reached the Fed’s target. In fact, inflation remains higher than the beginning of three of the four previous interest rate hiking cycles.
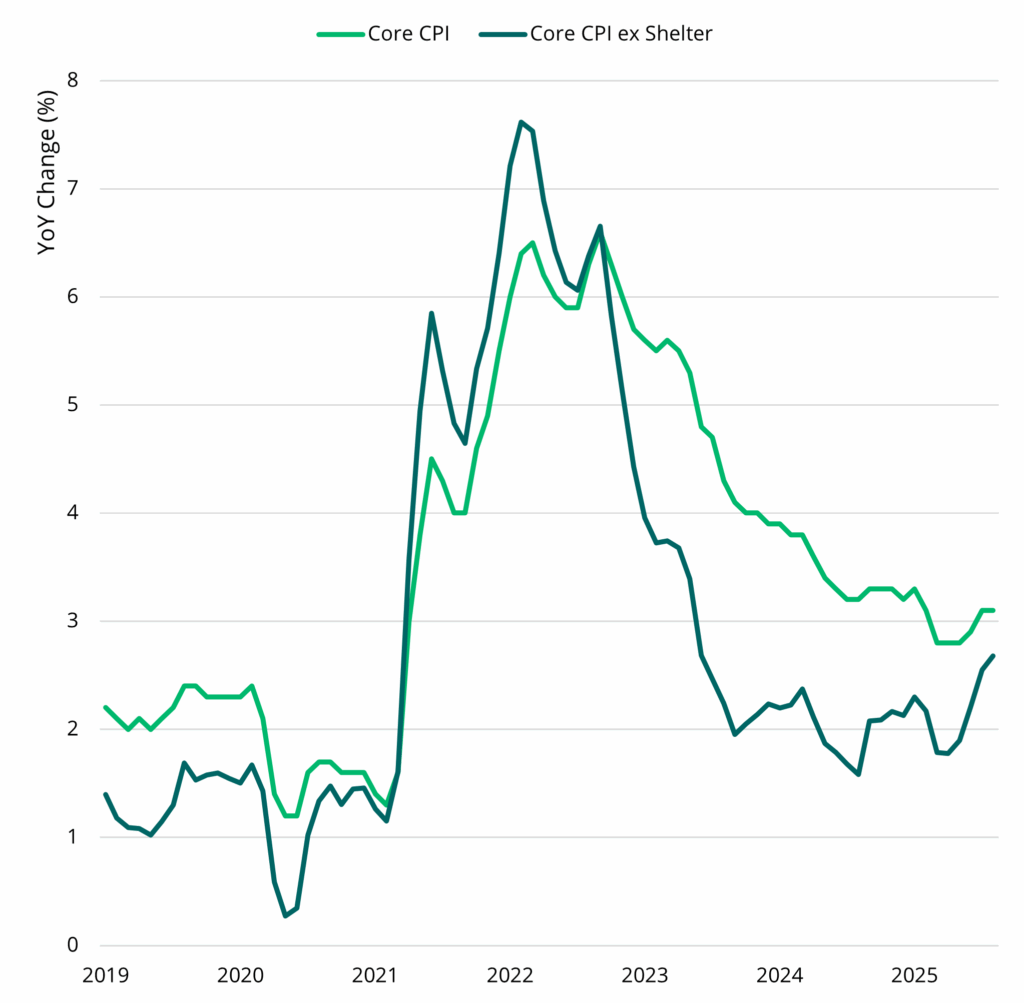
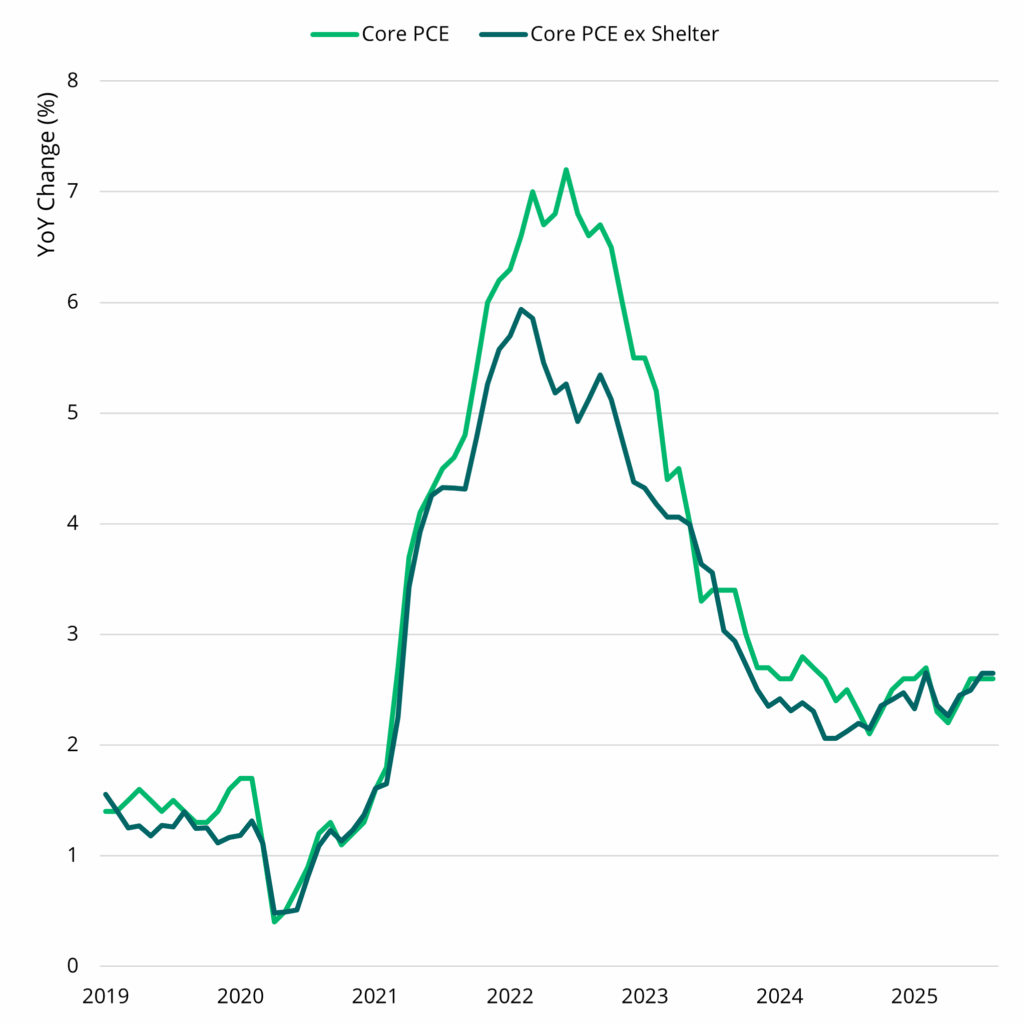
If the Fed does cut, one of the challenges in abandoning the 2 percent inflation target is that this is no longer a story about sticky, lagging shelter inflation (see below). Core CPI minus housing and Core PCE minus housing show that non-shelter components have moved up a bit since the middle of last year. Meanwhile, shelter components have decelerated.
Core CPI ex Shelter Increasing in Recent Monthsiii
Core PCE Readings In-line with Core ex Shelteriv
If inflation is no longer the primary target, what does labor market data tell us?
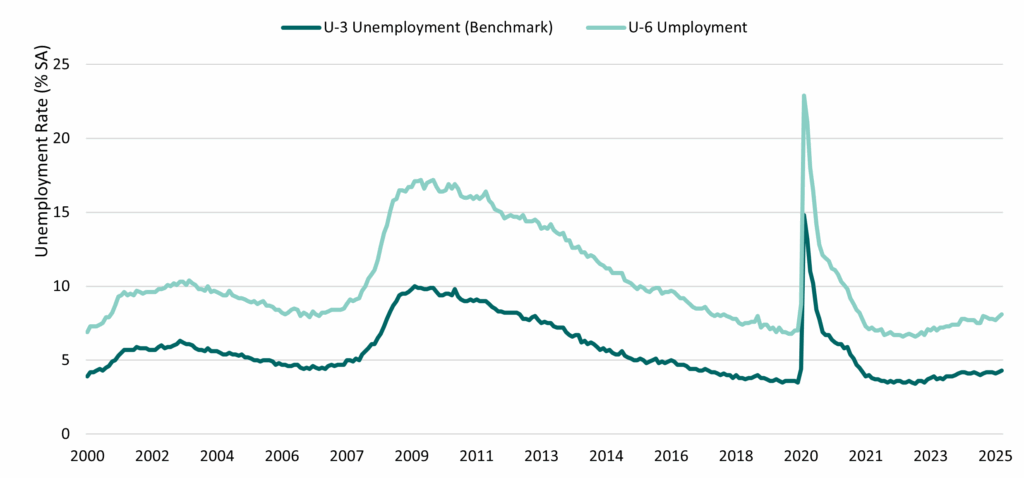
From an unemployment perspective, the standard benchmark, the U-3 level, remains near historically low levels below 5 percent, signaling limited slack. Under-employment (the U-6 measure), which includes unemployed people having difficulty finding a job and involuntary part time workers, also appears contained and near historic lows (see below).
Low Rates for U-3 Unemployment and U-6 (Includes Marginally Attached and Involuntarily Part-Time Workers)v
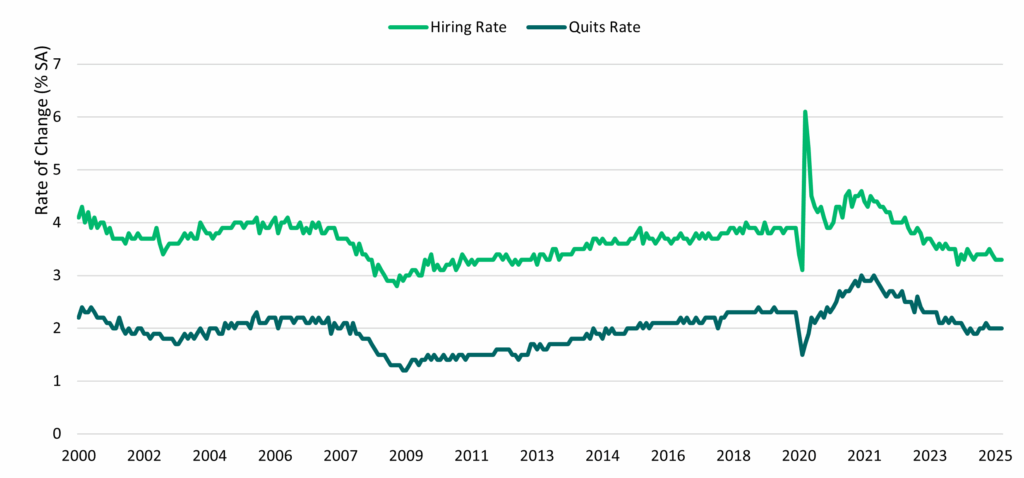
Turning to hiring data from the BLS JOLTS repot (“Job Opening and Labor Turnover Survey”), we see less labor market churn than in recent years (see below). Fewer people are voluntarily leaving their jobs on a monthly basis, and as fewer jobs are required to backfill their departures, we are seeing both the hiring and quits rates decline—arguably that is a measure of labor market stability.
The Churn of “Job Switchers” Has Subsided as Hiring Has Slowedvi
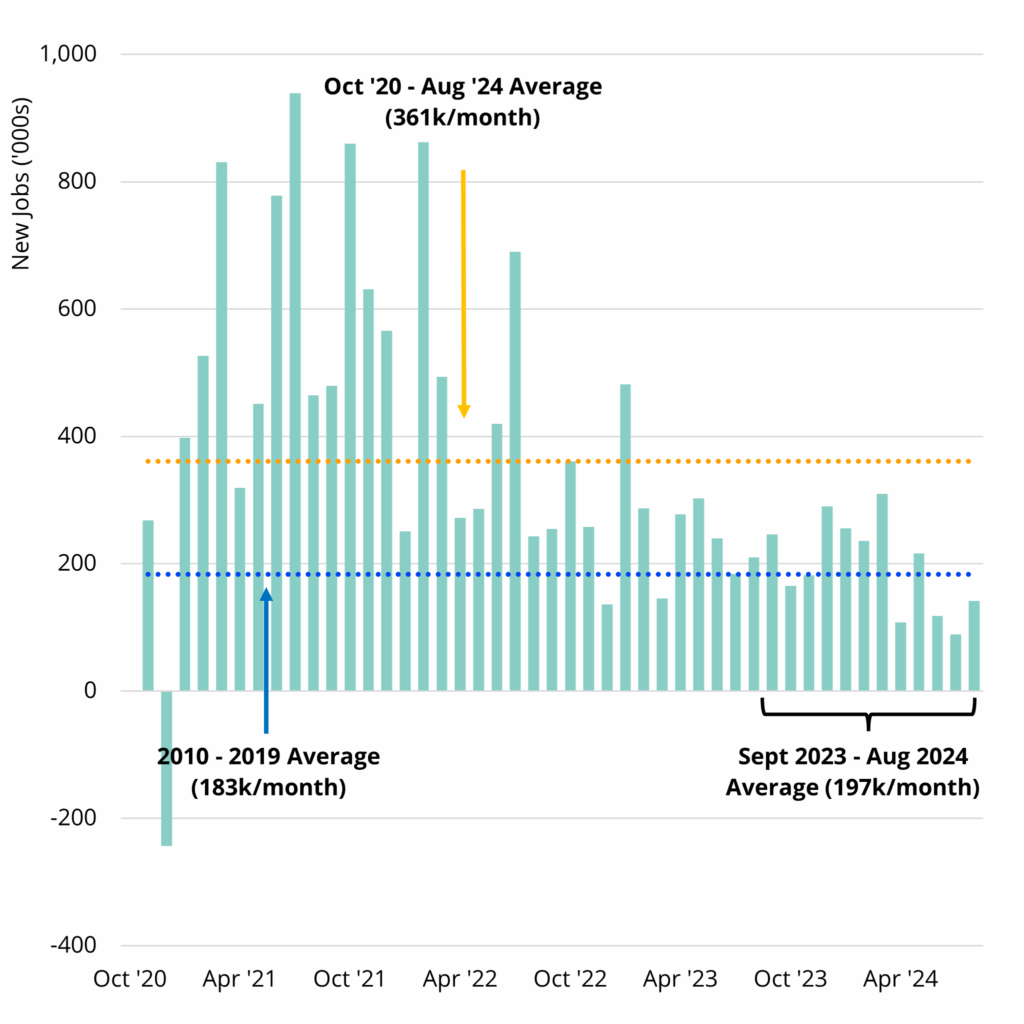
Recent BLS revisions have come into focus as well. The first visual below is employment growth before the September 2024 jumbo-sized downward revision by the BLS. The second includes both the 2024 and 2025 BLS revisions, which shows that job growth after 2020 was less hot than initially believed, and the past year has seen relatively underwhelming job growth figures.
Nonfarm Employment Growth Prior to September 2024 Revisionsvii
Nonfarm Employment Growth After 2024 and 2025 Revisionsviii
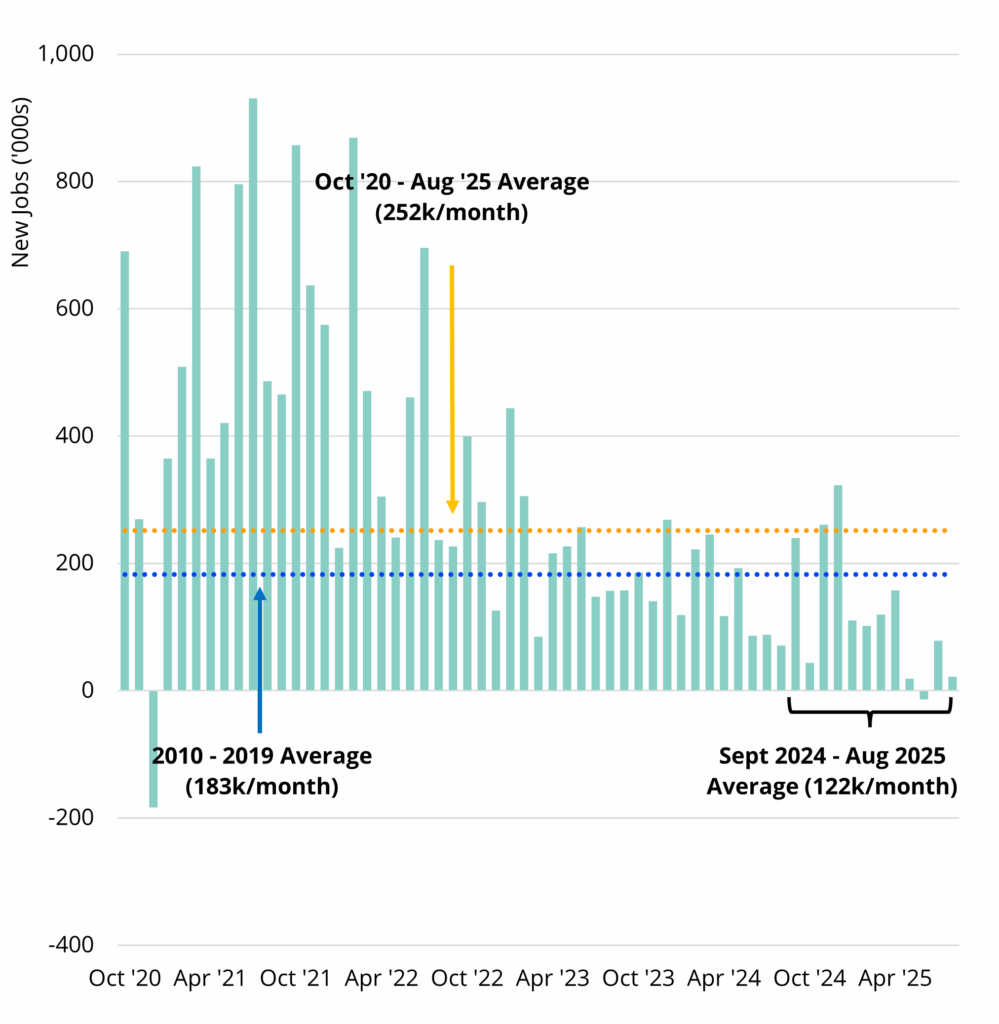
However, it is important to note that underwhelming does not mean that the labor market is losing ground. According to St. Louis Fed economists who analyze the breakeven rate, expected lower immigration this year may have lowered the breakeven rate to somewhere between 32,000 and 82,000 jobs per month on average.ix Over the past year, we have seen 122,000 jobs per month.
So, what does the market tell us right now? Rising yields on the long end of the curve might suggest a lack of confidence that inflation is under control. At the same time, the 2- and 10-year spread has been in positive territory for over a year following a two-year inversion, which is rare re-steepening without seeing a recession.
It appears that stagflation has emerged as the front running concern that may require the Fed to adjust its policy stance. And since that is outside of the Fed’s dual mandate, we will see how they thread the needle on this this week—both with respect to providing an understanding of a policy framework going forward as well as providing assurance to markets.
i Board of Governors of the Federal Reserve System. FAQs: What economic goals does the Federal Reserve seek to achieve through its monetary policy? As of September 12, 2025. Accessed at: https://www.federalreserve.gov/faqs/what-economic-goals-does-federal-reserve-seek-to-achieve-through-monetary-policy.htm
ii Board of Governors of the Federal Reserve System. FAQs: What economic goals does the Federal Reserve seek to achieve through its monetary policy? As of September 12, 2025. Accessed at: https://www.federalreserve.gov/faqs/what-economic-goals-does-federal-reserve-seek-to-achieve-through-monetary-policy.htm
iii Bloomberg as of September 11, 2025.
iv Bloomberg as of September 11, 2025.
v Bloomberg as of September 11, 2025.
vi Bloomberg as of September 11, 2025.
vii Bloomberg as of September 4, 2024.
viii Bloomberg as of September 11, 2025.
ix Bick, Alexander. August 28, 2025. Lower Immigration Projections Mean Lower Breakeven Employment Growth Estimates. Federal Reserve Bank of St. Louis.
subscribe to our market outlooks and sector insights
Disclosures
The information herein is provided for educational purposes only and should not be construed as financial or investment advice, nor should any information in this document be relied on when making an investment decision. Opinions and views expressed reflect the current opinions and views of the author(s) and Bridge Analysts as of the date hereof and are subject to change at any time without notice. Please see the end of this document for important disclosure information.
Important Disclosure Information
This material is for educational purposes only and should not be treated as research. This material may not be distributed, transmitted or otherwise communicated to others, in whole or in part, without the express written consent of Bridge Investment Group Holdings LLC (together with its affiliates, “Bridge”).
The views and opinions expressed in this material are the views and opinions of the author(s) of the material. They do not necessarily reflect the views and opinions of Bridge and are subject to change at any time without notice. Further, Bridge and its affiliates may have positions (long or short) or engage in securities transactions that are not consistent with the information and views expressed in this material. There can be no assurance that an investment strategy will be successful. Historic market trends are not reliable indicators of actual future market behavior or future performance of any particular investment which may differ materially and should not be relied upon as such. Target allocations contained herein are subject to change. There is no assurance that the target allocations will be achieved, and actual allocations may be significantly different than that shown here.
This material does not constitute an offer of any service or product of Bridge. It is not an invitation by or on behalf of Bridge to any person to buy or sell any security or to adopt any investment strategy, and shall not form the basis of, nor may it accompany nor form part of, any right or contract to buy or sell any security or to adopt any investment strategy. Nothing herein should be taken as investment advice or a recommendation to enter into any transaction.
Hyperlinks to third-party websites in this material are provided for reader convenience only. Unless otherwise noted, information included herein is presented as of the dates indicated. This material is not complete, and the information contained herein may change at any time without notice. Bridge does not have any responsibility to update the material to account for such changes. Bridge has not made any representation or warranty, expressed or implied, with respect to fairness, correctness, accuracy, reasonableness, or completeness of any of the information contained herein, and expressly disclaims any responsibility or liability, therefore. The information contained herein is not intended to provide, and should not be relied upon for, accounting, legal or tax advice or investment recommendations. Investors should make an independent investigation of the information contained herein, including consulting their tax, legal, accounting or other advisors about such information. Bridge does not act for you and is not responsible for providing you with the protections afforded to its clients.
Certain information contained herein may be “forward-looking” in nature. Due to various risks and uncertainties, actual events or results may differ materially from those reflected or contemplated in such forward-looking information. As such, undue reliance should not be placed on such information. Forward-looking statements may be identified by the use of terminology including, but not limited to, “may”, “will”, “should”, “expect”, “anticipate”, “target”, “project”, “estimate”, “intend”, “continue” or “believe” or the negatives thereof or other variations thereon or comparable terminology. Any reference to indices, benchmarks, or other measure of relative market performance over a specified period of time are provided for context and for your information only.
Past performance is not necessarily indicative of future results.
Additional information may be available upon request.
© 2025 Bridge Investment Group Holdings LLC. “Bridge Investment Group” and certain logos contained herein are trademarks owned by Bridge.
ATLWAA-20250916-4828241-15212404