
Multifamily
Key Takeaways

Multifamily
Renters
Asset value
What is multifamily real estate?
Percentage Share of Owners and Renters by Age of Householderiv
Who lives in multifamily rental?
Approximately half of multifamily residents are single individuals,v with most renters skewing younger and earning under $75,000 annually. However, the profile of US renters is evolving—diversifying across both income levels and age groups—which is expected to further bolster rental demand in the coming cycle.
The Expanding Renter Base: Income and Age Diversity
By income:
While most renters earn below $75,000 annually,vi the share of high-income renters is growing, challenging the idea that rentership is purely need-based. Between 2010 and 2023, the number of renters earning $75,000+ more than doubled,vii with a notable rise in those earning over $100,000. While affordability challenges in the ownership market are a key driver of the rise in high-income renters, many of these households are also renting by choice. Based on our estimates, at least 22% of renters are likely choosing to rent by preference rather than necessity.viii
By age:
While younger cohorts remain the primary driver of rental demand, we are seeing growth in older renter segments: Renters aged 55-84 grew by 42% since 2010, compared to just 7% growth among those under 55 during the same period.ix These older renters are often drawn to the flexibility and lower maintenance responsibilities of renting, increasing demand—particularly for communities that cater to their lifestyle needs.
What are the secular drivers of this sector?
At its core, housing demand remains largely insulated from short-term economic fluctuations. Regardless of near-term disruptions, people still need a place to live—making residential rental housing one of the more stable asset classes across market cycles. This stability creates a natural hedge against economic uncertainty, supported by several underlying demand drivers:
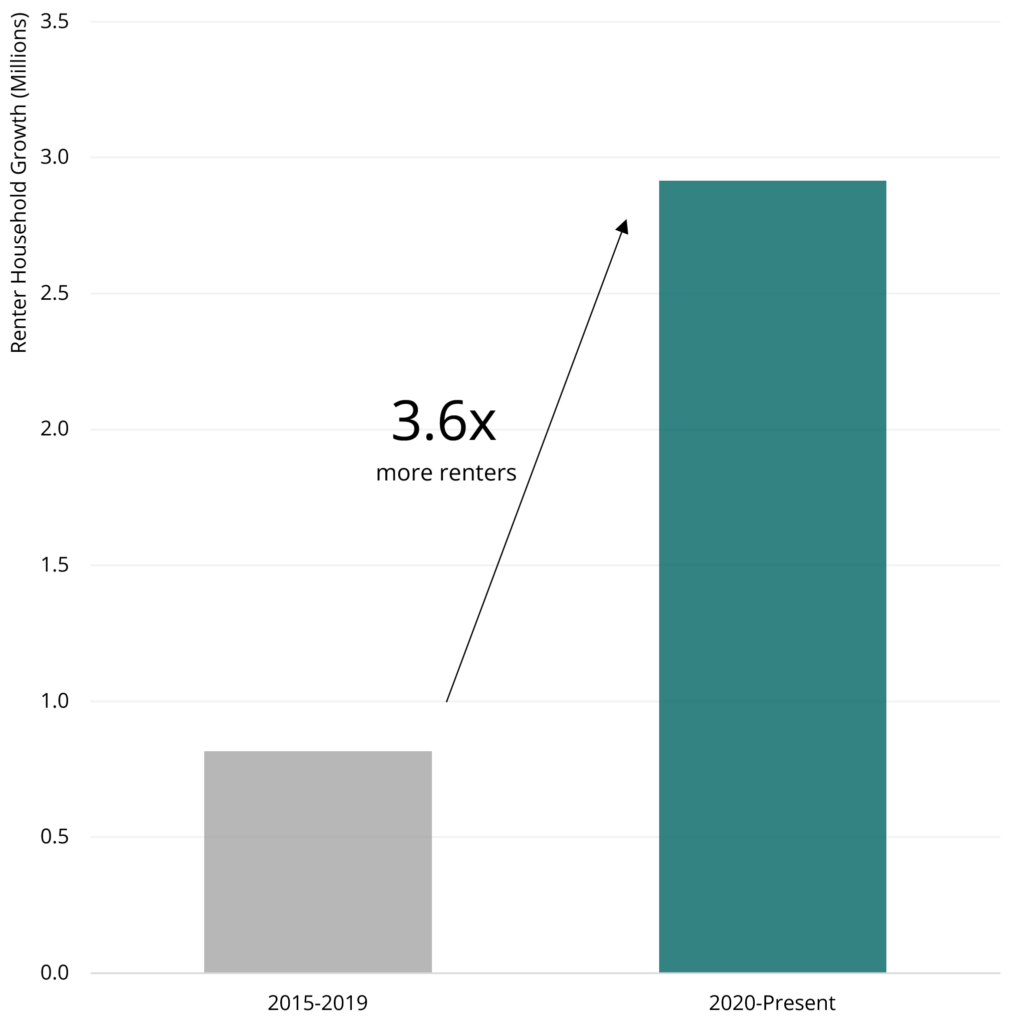
Demographic tailwinds: Renter demographics are not only evolving but also growing. Since the end of 2019, the number of renter households has risen by 2.9 million, reaching 46.2 million in 2025x —further amplifying demand for multifamily housing.
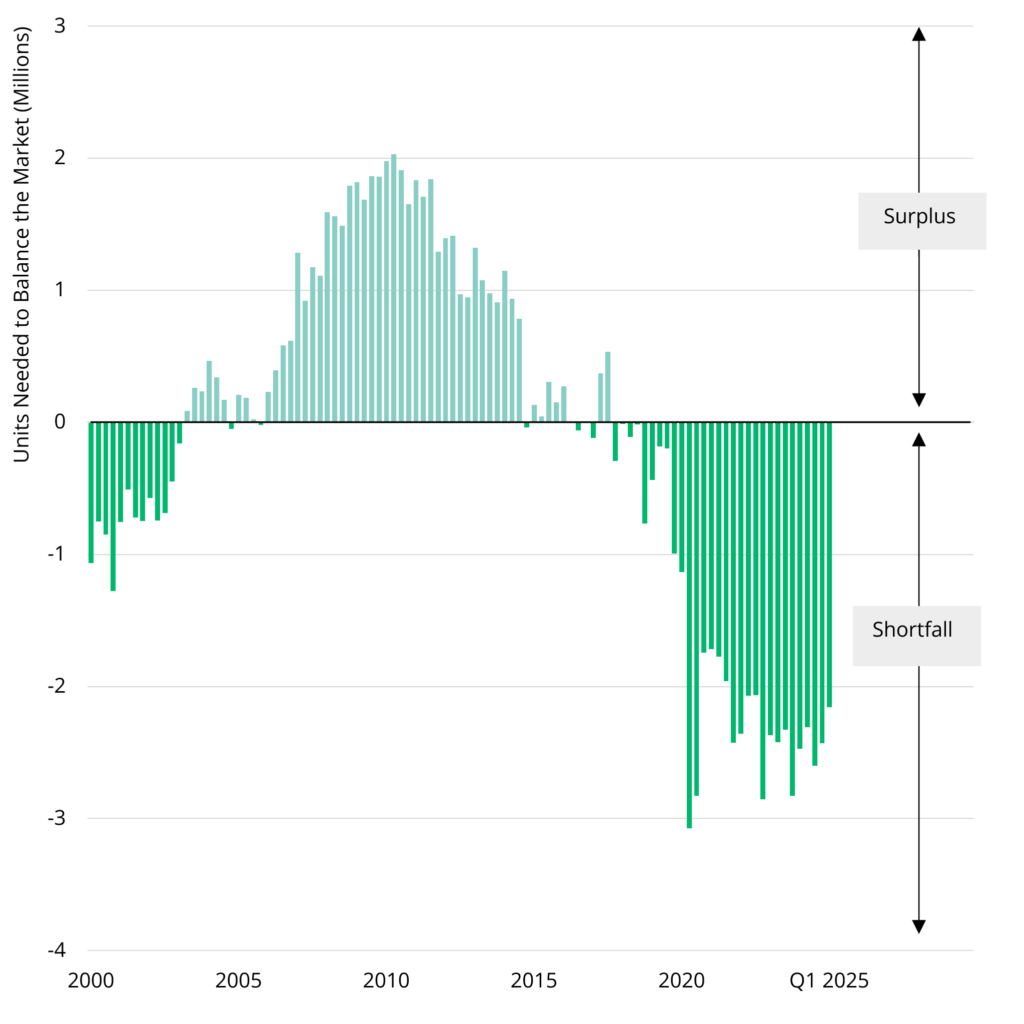
Supply shortage: The supply of available housing has not kept pace with rising demand. Both single-family and multifamily construction were slow to recover after the 2008 financial crisis, and as the recent wave of new supply begins to recede, the US market remains significantly undersupplied. Our analysis estimates that an additional 2.2 million vacant units are needed to bring the national housing vacancy rate back in line with long-term historical trends.xi With fewer new units being delivered, the supply-demand imbalance is expected to persist—supporting long-term fundamentals and sustaining rental housing demand.
Affordability: Rising demand and limited supply have intensified affordability challenges, further strengthening the case for multifamily housing. Between 2021 and 2023, 74% of new renter households were cost burdened,xii and nearly half of all renters faced similar pressure in 2023.xiii At the same time, the US falls short by 3.2 million affordable units needed to accommodate low- and modest-income renters.xiv Moreover, homeownership has become increasingly out of reach, as elevated home prices and mortgage rates have significantly eroded affordability, pushing the median age of first-time buyers to an all-time high of 38 in 2024.xv With construction and replacement costs continuing to rise, the supply of new affordable housing also remains constrained—reinforcing sustained demand for rental housing across demographics.
2.9 Million Renters Were Added Between 2019 and 2025xvi
2.2 Million Units Needed to Balance the US Housing Marketxvii
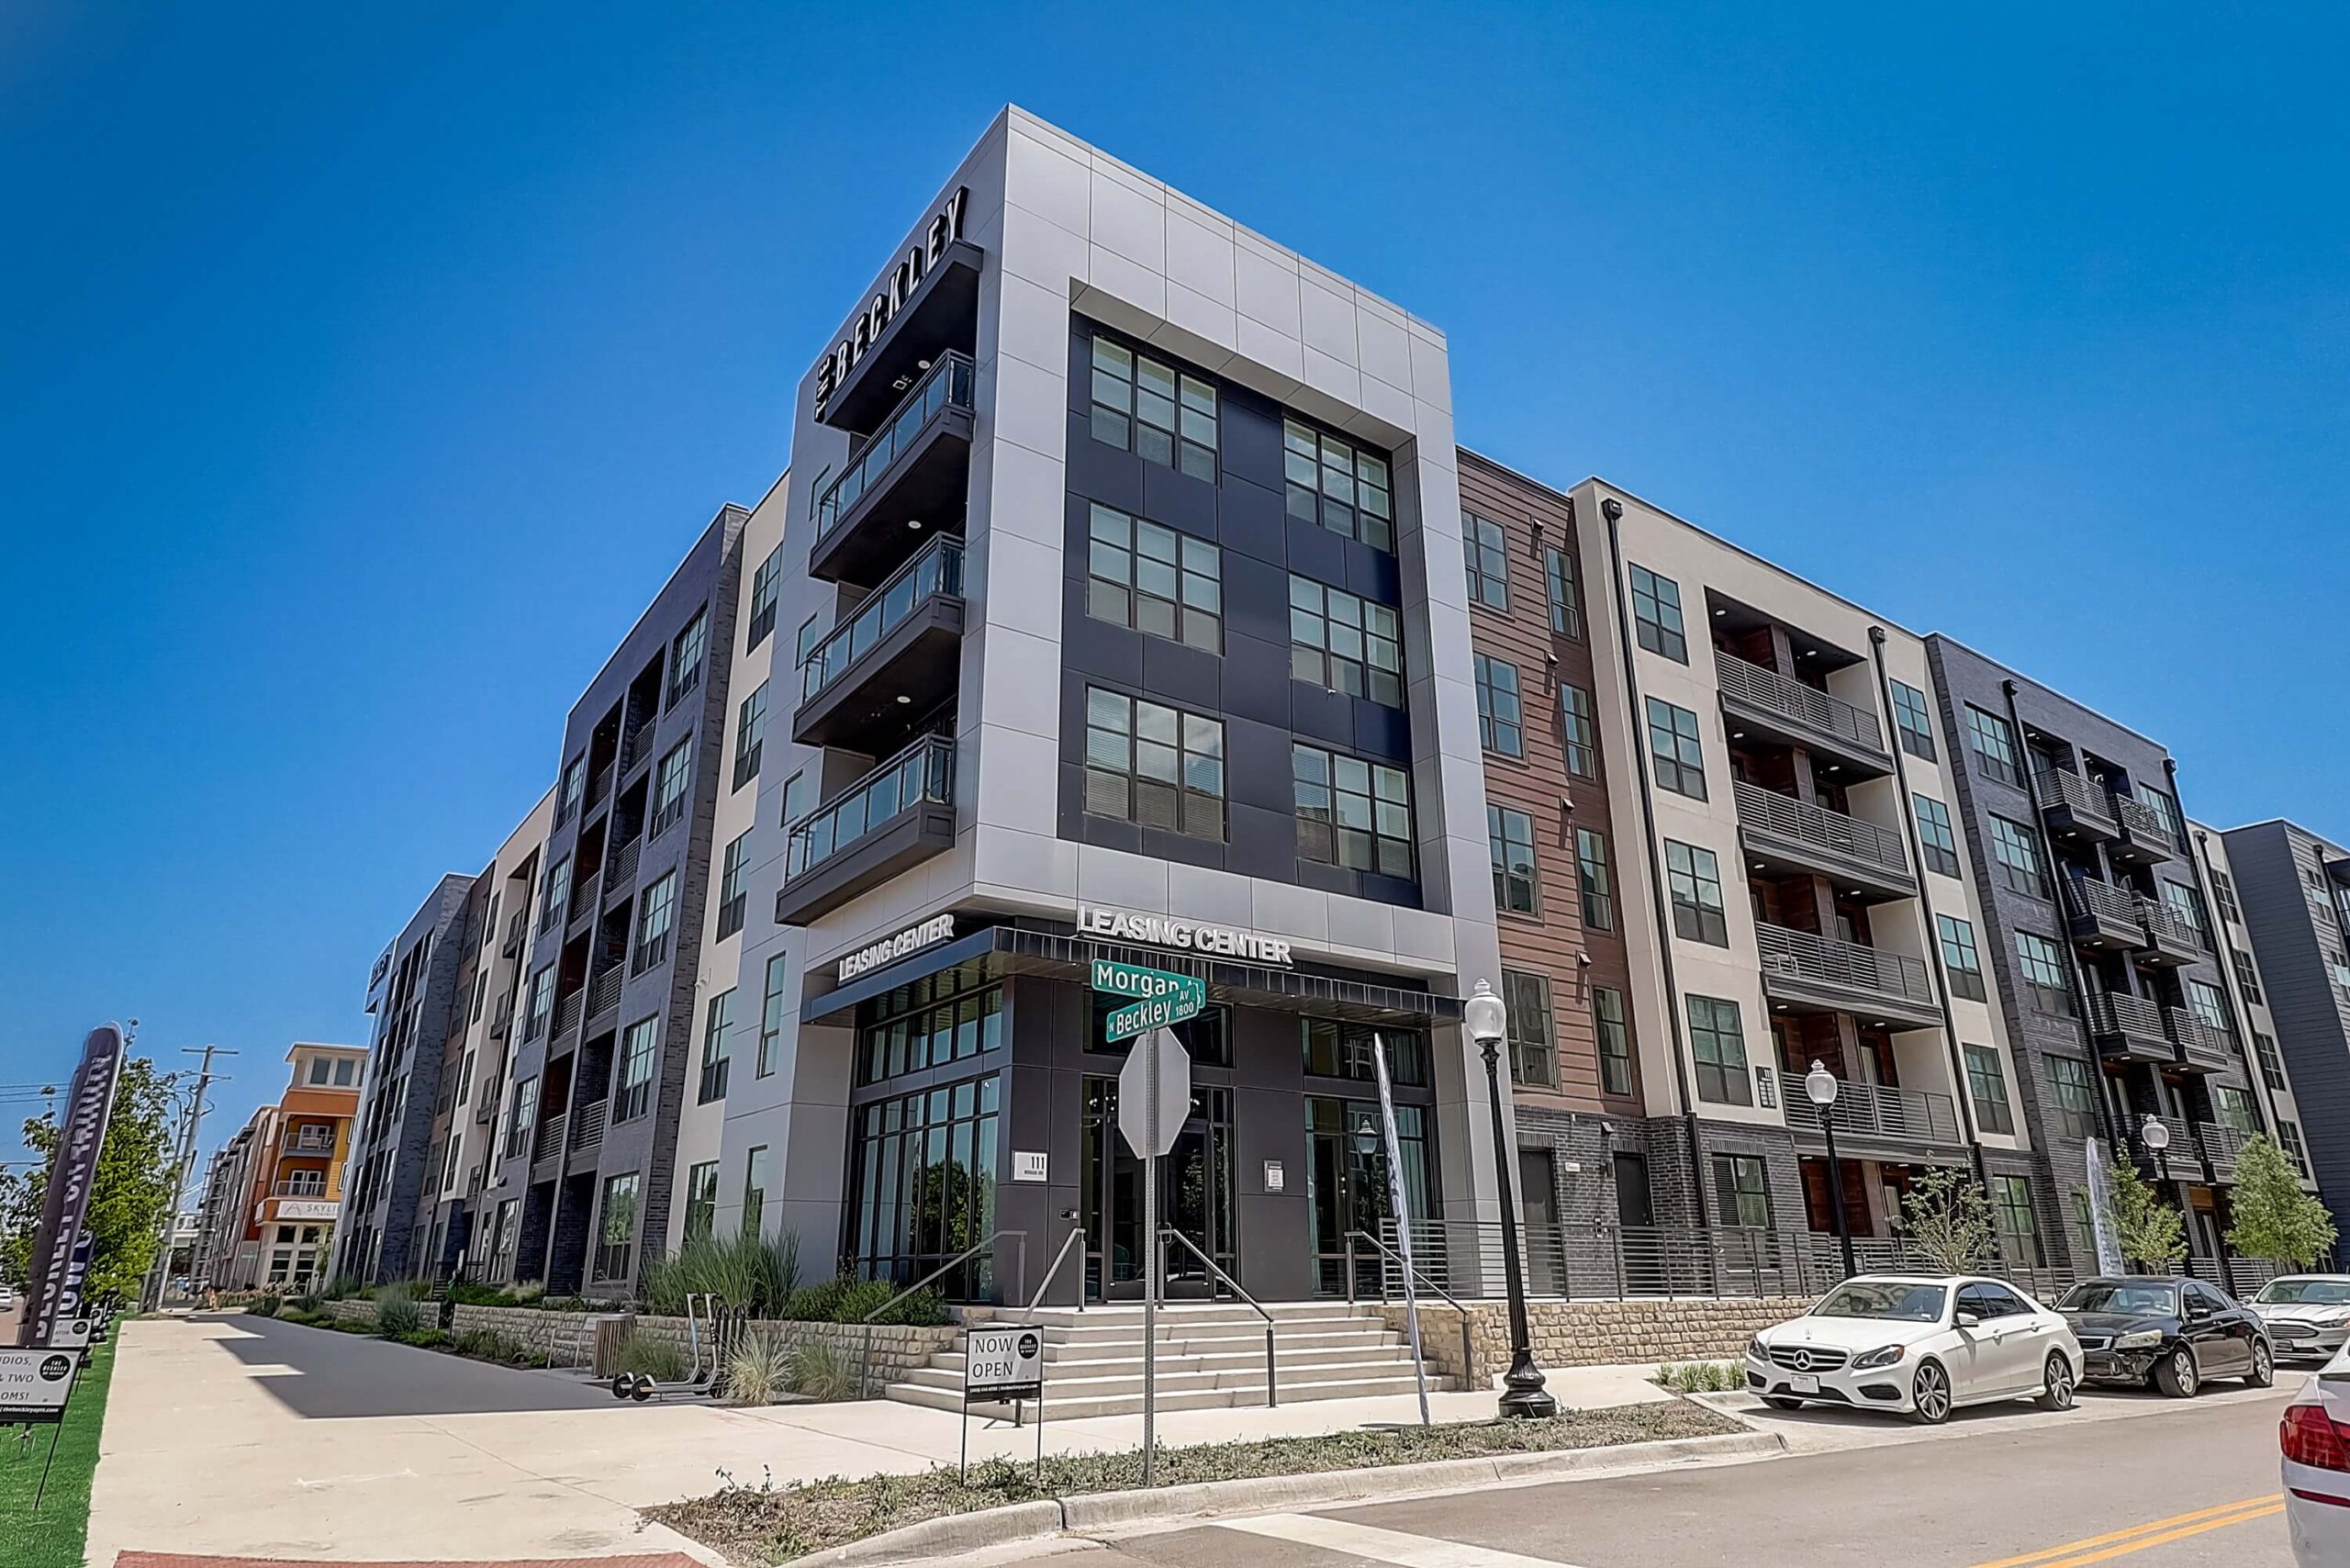
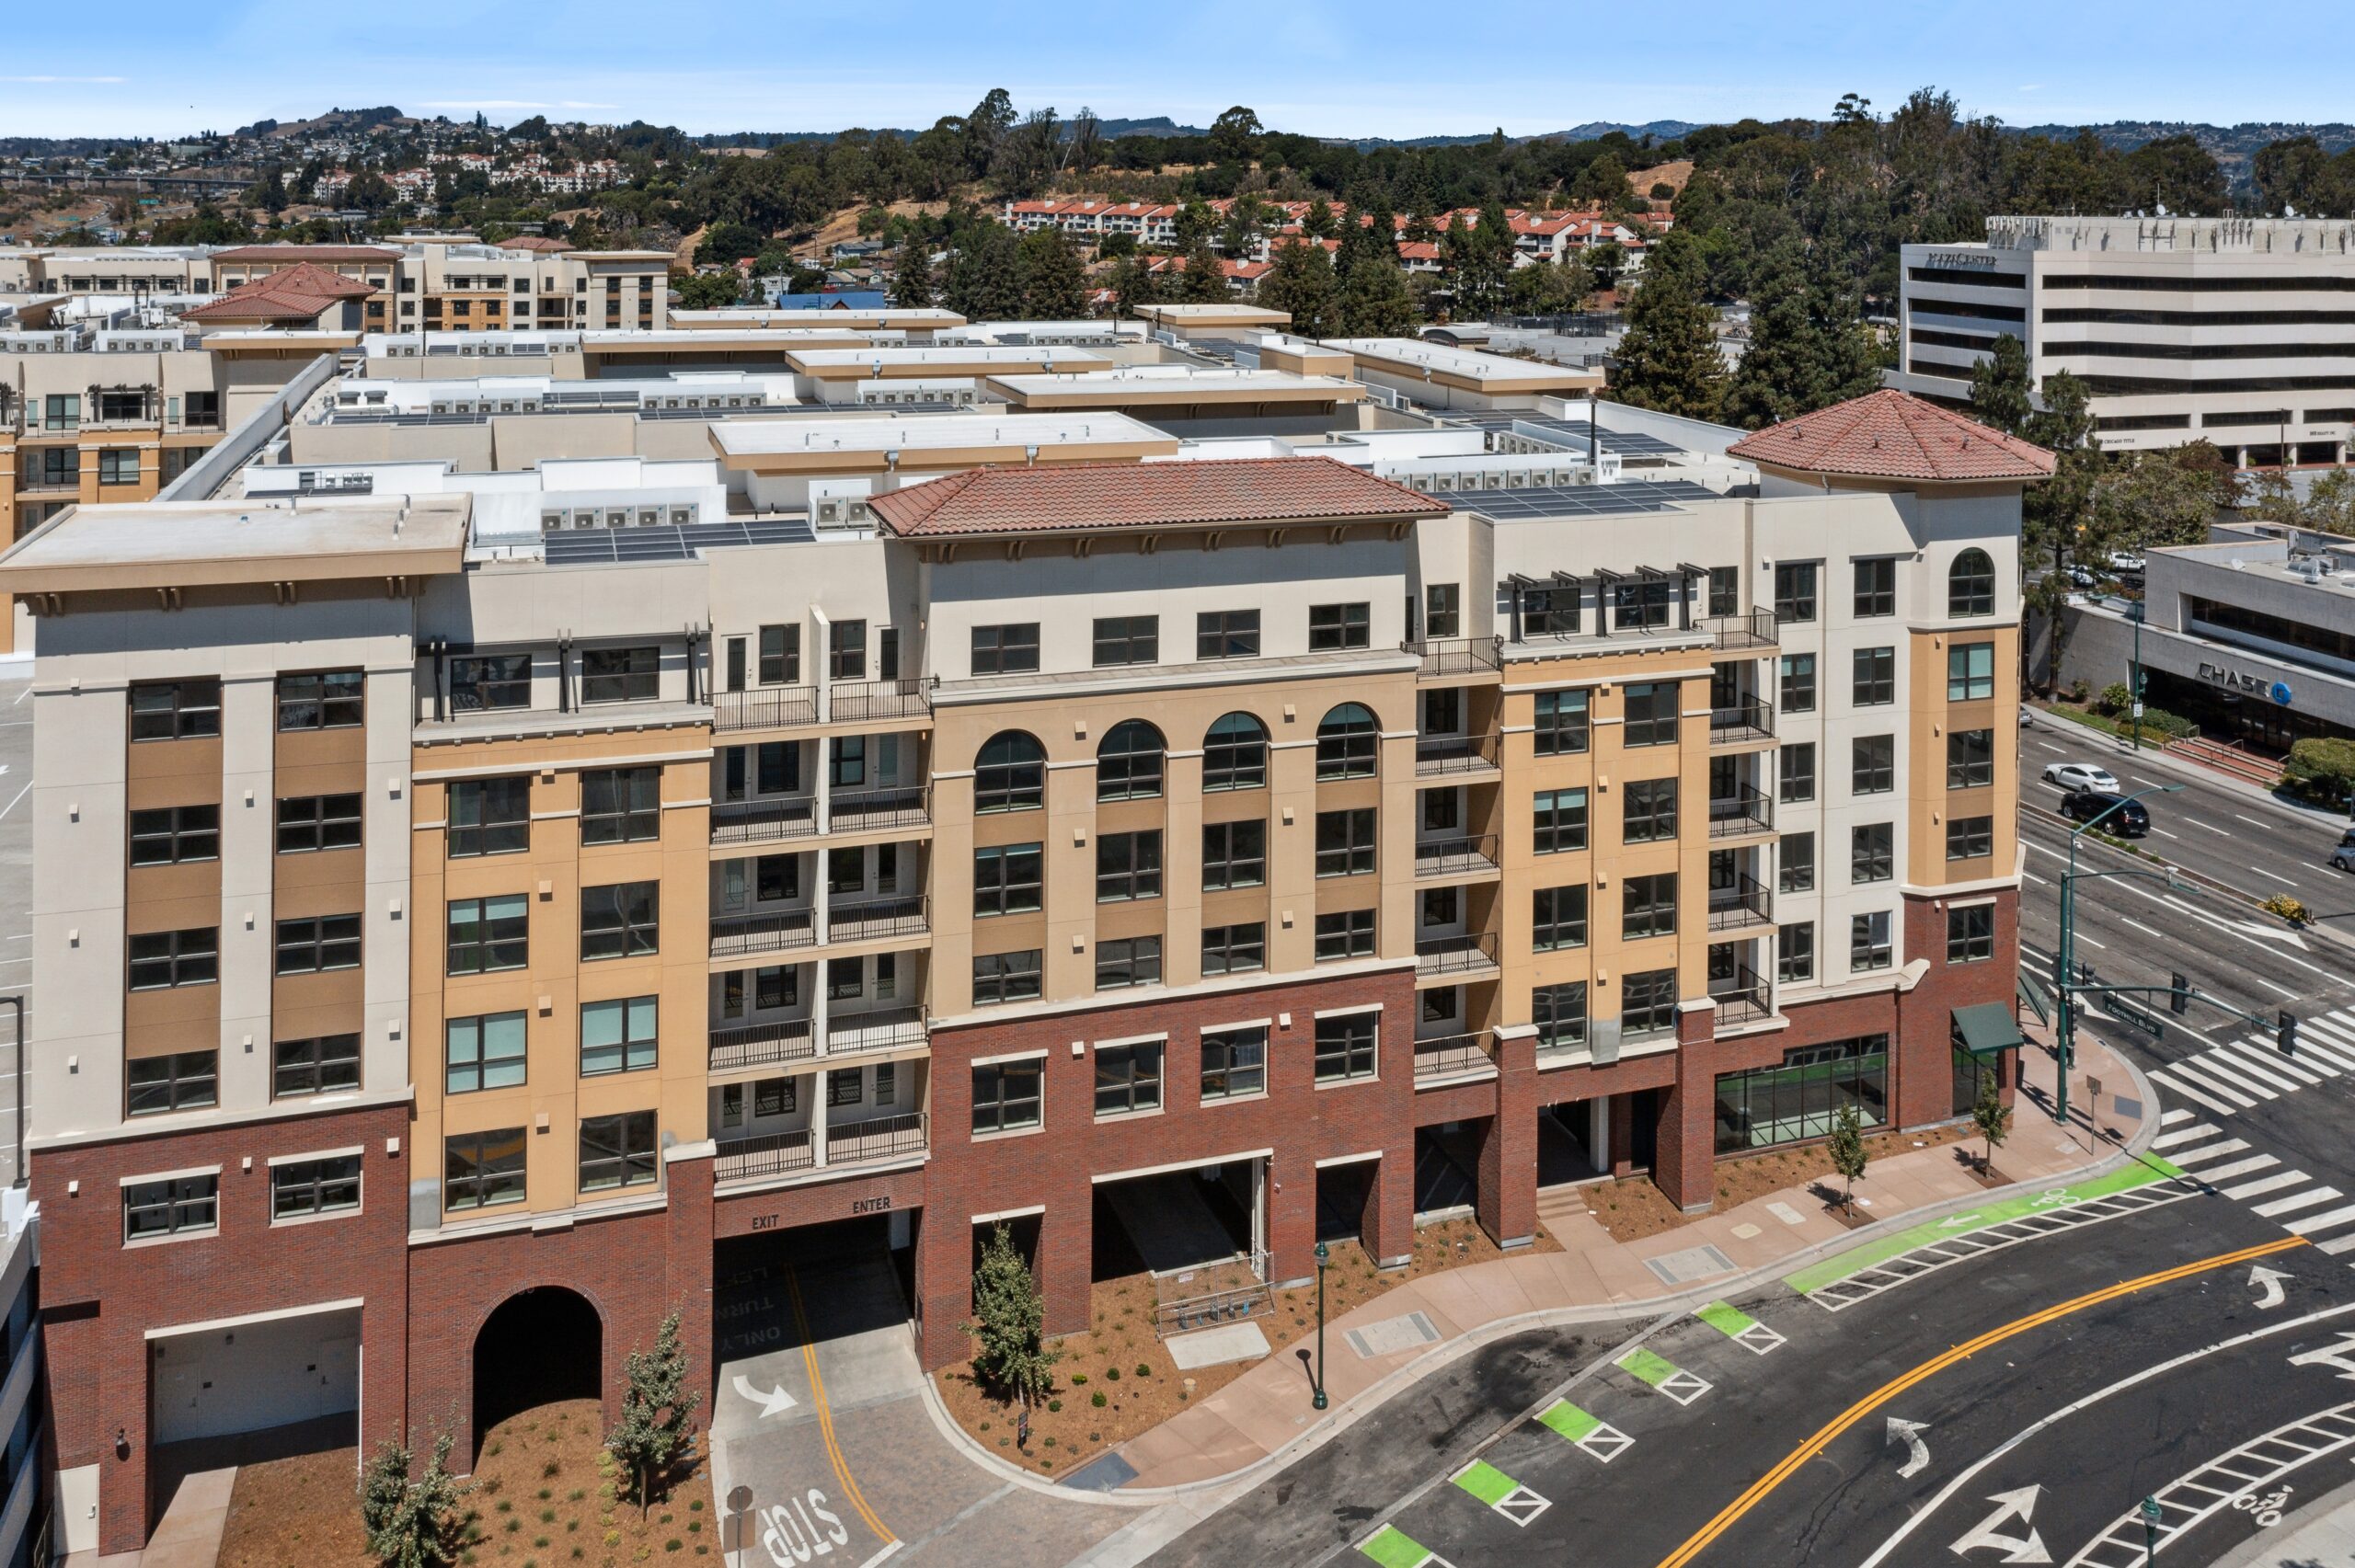
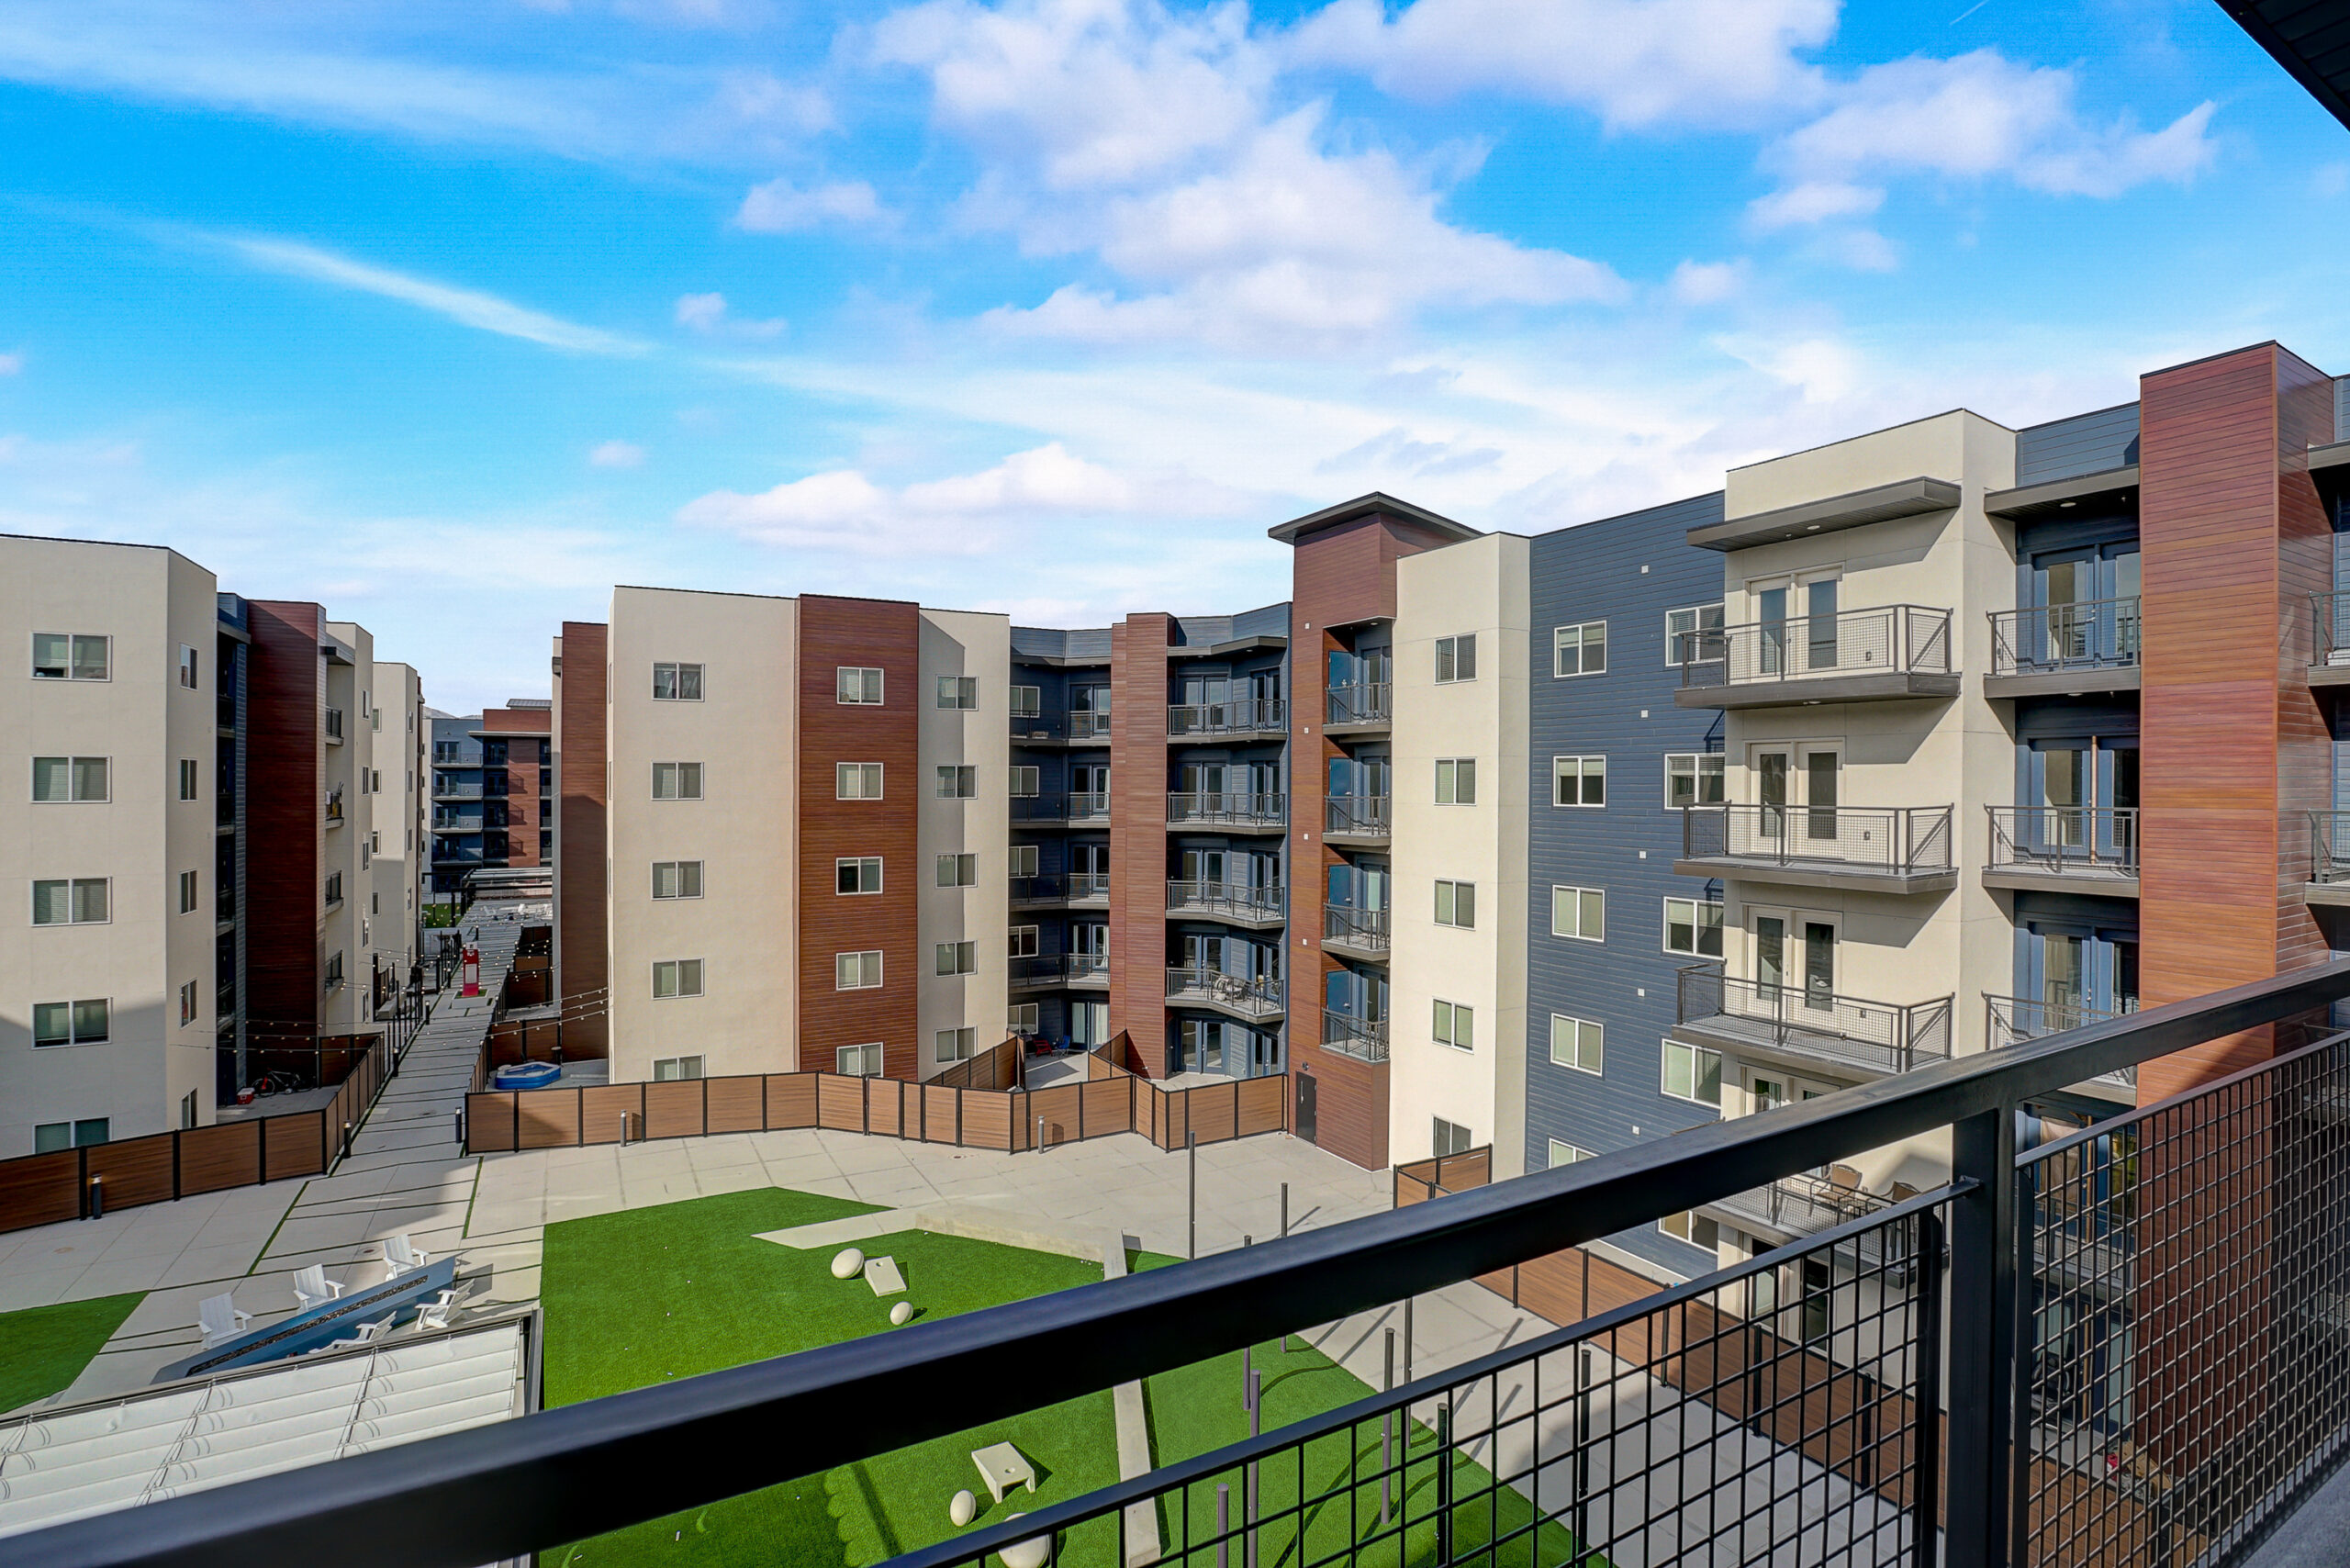
What are the common building types?
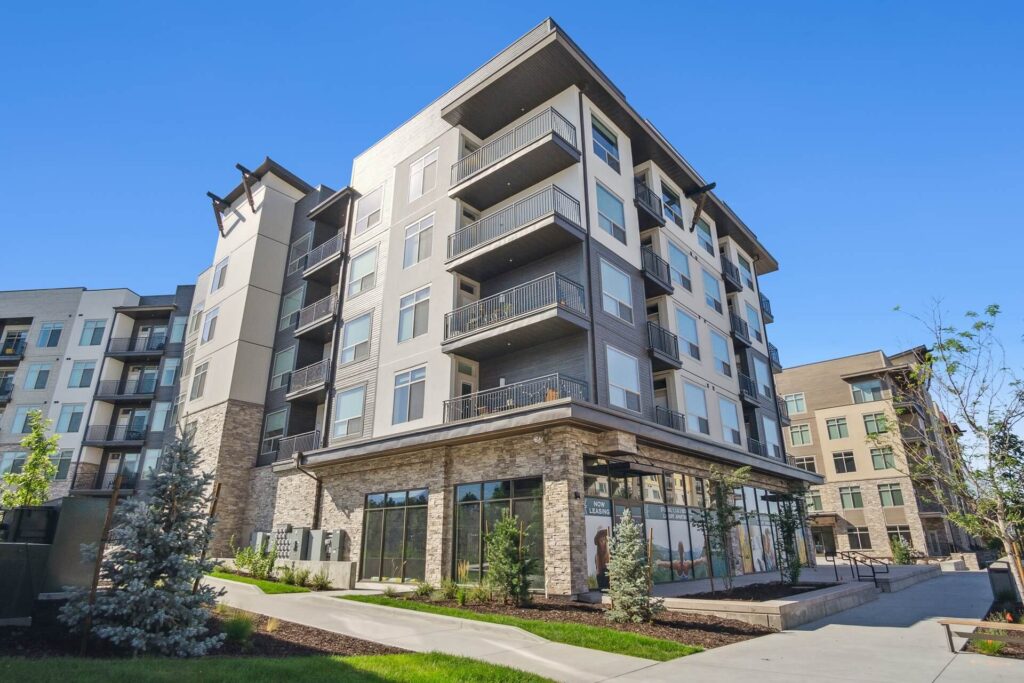
Common multifamily building types are garden style, low-rise, mid-rise, and high-rise. Low-rise, mid-rise, and high-rise have one to three, four to six, and seven or more floors, respectively and garden style apartments tend to have between two and six floors where buildings are spread out across the property and is surrounded by landscaped areas with lawns and trees.xviii
Across these property types, class ratings are often used to represent the quality of the property. Factors such as age of the property, amenities, location, can impact the rating. Class A normally commands higher market-clearing rents than Class B and C.
Garden Style

Low-Rise

Mid-Rise

High-Rise

|
Class A |
Class B |
Class C |
|
|---|---|---|---|
|
Property Age |
Tends to be newer construction, less than 10 years old. |
Typically built between 1980 and 2009. |
Often built prior to 1980. |
|
Typical Location |
Urban core with access to universities, major employers, restaurants, shopping, and public transit. |
Typically located outside of the urban core and in a submarket with good local economy. |
Poorly located products often with limited access to employment opportunities and quality schools. |
|
Common Amenities |
Fitness centers, resort-style pools, coworking stations, and media rooms. |
Grilling stations, pools, dog runs, and/or clubhouses. |
Generally fewer tenant amenities and meaningful deferred maintenance. |
|
Opportunities for Value Creation |
Generally, core/high-end product, with top-notch resident support and efficient maintenance programs to preserve quality. |
Renovate units, update and/or add new amenities. |
Substantial capex injection with structural repairs needed for value creation often due to deferred maintenance. |
What drives value at the asset level?
Identifying Value
Investment managers can drive value prior to acquisition by identifying highly sought after, in-demand renter locations with positive neighborhood characteristics, quality school systems, and proximity to jobs.
Active Management
Investment managers can create value through executing renovations in older units, which typically involves updating amenities and unit finishes. Asset repositioning can create opportunities to drive value at the asset level while upgraded resident services can enhance resident satisfaction and brand reputation.
Explore Private Markets Further
Explore select private market asset classes to understand better what they are, who uses them, and the potential to identify value.


Explore Private Real Estate Asset Classes
Explore select private market asset classes to understand better what they are, who uses them, and the potential to identify value.

The information herein is provided for educational purposes only and should not be construed as financial or investment advice, nor should any information in this document be relied on when making an investment decision. Opinions and views expressed reflect the current opinions and views of the author(s) and Bridge Analysts as of the date hereof and are subject to change at any time without notice. Please see the end of this document for important disclosure information.
Important Disclosure Information
This material is for educational purposes only and should not be treated as research. This material may not be distributed, transmitted or otherwise communicated to others, in whole or in part, without the express written consent of Bridge Investment Group Holdings LLC (together with its affiliates, “Bridge”).
The views and opinions expressed in this material are the views and opinions of the author(s) of the material. They do not necessarily reflect the views and opinions of Bridge and are subject to change at any time without notice. Further, Bridge and its affiliates may have positions (long or short) or engage in securities transactions that are not consistent with the information and views expressed in this material. There can be no assurance that an investment strategy will be successful. Historic market trends are not reliable indicators of actual future market behavior or future performance of any particular investment which may differ materially and should not be relied upon as such. Target allocations contained herein are subject to change. There is no assurance that the target allocations will be achieved, and actual allocations may be significantly different than that shown here.
This material does not constitute an offer of any service or product of Bridge. It is not an invitation by or on behalf of Bridge to any person to buy or sell any security or to adopt any investment strategy, and shall not form the basis of, nor may it accompany nor form part of, any right or contract to buy or sell any security or to adopt any investment strategy. Nothing herein should be taken as investment advice or a recommendation to enter into any transaction.
Hyperlinks to third-party websites in this material are provided for reader convenience only. Unless otherwise noted, information included herein is presented as of the dates indicated. This material is not complete, and the information contained herein may change at any time without notice. Bridge does not have any responsibility to update the material to account for such changes. Bridge has not made any representation or warranty, expressed or implied, with respect to fairness, correctness, accuracy, reasonableness, or completeness of any of the information contained herein, and expressly disclaims any responsibility or liability, therefore. The information contained herein is not intended to provide, and should not be relied upon for, accounting, legal or tax advice or investment recommendations. Investors should make an independent investigation of the information contained herein, including consulting their tax, legal, accounting or other advisors about such information. Bridge does not act for you and is not responsible for providing you with the protections afforded to its clients.
Certain information contained herein may be “forward-looking” in nature. Due to various risks and uncertainties, actual events or results may differ materially from those reflected or contemplated in such forward-looking information. As such, undue reliance should not be placed on such information. Forward-looking statements may be identified by the use of terminology including, but not limited to, “may”, “will”, “should”, “expect”, “anticipate”, “target”, “project”, “estimate”, “intend”, “continue” or “believe” or the negatives thereof or other variations thereon or comparable terminology. Any reference to indices, benchmarks, or other measure of relative market performance over a specified period of time are provided for context and for your information only.
Past performance is not necessarily indicative of future results.
Additional information may be available upon request.
© 2025 Bridge Investment Group Holdings LLC. “Bridge Investment Group” and certain logos contained herein are trademarks owned by Bridge.
- Area Median Income (AMI): Area median income is defined as the midpoint of a specific area’s income distribution and is calculated on an annual basis by the Department of Housing and Urban Development.
- Cost burdened Renters: Renters that pay 30% or more of their income in rent.
- Capital Expenditures: Investments made to acquire, improve, and maintain an asset.
- Renters by Choice: Have sufficient wealth to own but choose to rent.
- Renters by Necessity: Have insufficient wealth to acquire home/condo.
- Core: Core assets tend to be higher quality, “turnkey” properties in attractive locations, and investment managers typically use a low level of leverage to acquire properties.
- Core-Plus: Core plus assets are high quality properties with modest opportunities to add value through light property improvements and often more leverage compared to core properties.
i Freddie Mac Multifamily, The Difference Between Multifamily and Single-Family Businesses, as of Jan 2024.
ii U.S. Census Bureau, 2023 American Community Survey 1-Year Estimates, Table B25032.
iii U.S. Census Bureau, 2023 American Community Survey 1-Year Estimates, Table B25032.
iv U.S. Census Bureau, 2023 American Community Survey 1-Year Estimates, Table B25007.
v U.S. Census Bureau, 2023 American Community Survey 1-Year Estimates, Table B25124.
vi U.S. Census Bureau, 2023 American Community Survey 1-Year Estimates, Table B25118.
vii U.S. Census Bureau, 2023 American Community Survey 1-Year Estimates, Table B25118.
viii Internal Analysis of mortgage costs, U.S. Census Bureau, 2023 American Community Survey 1-Year Estimates, Table B25118 & Moody’s Baseline Scenario Existing Single-Family Median Home Price and 30-Yr Fixed Mortgage Rate, as of March 2025.
ix U.S. Census Bureau, 2023 American Community Survey 1-Year Estimates, Table B25007.
x U.S. Census Bureau, Housing Inventory Estimate: Renter Occupied Housing Units in the United States, via FRED, May 19, 2025.
xi Internal analysis of vacancy trends and household formation, U.S. Census Bureau, Current Population Survey/Housing Vacancy Survey. This figure likely understates the true housing shortfall, as it does not account for ongoing household formation.
xii U.S. Census Bureau, 2023 American Community Survey 1-Year Estimates.
xiii U.S. Census Bureau, 2023 American Community Survey 1-Year Estimates.
xiv National Low Income Housing Coalition, 2025 The Gap Report, March 2025.
xv National Association of Realtors, 2024 Profile of Home Buyers and Sellers Report.
xvi U.S. Census Bureau, Housing Inventory Estimate: Renter Occupied Housing Units in the United States, via FRED, May 19, 2025.
xvii Internal analysis of vacancy trends and household formation, U.S. Census Bureau, Current Population Survey/Housing Vacancy Survey as of Q1 2025.
xviii RealPage, as of January 2024.
ON THIS PAGE…