

The New Geography Of U.S. Manufacturing
Implications for Industrial and Logistics Real Estate
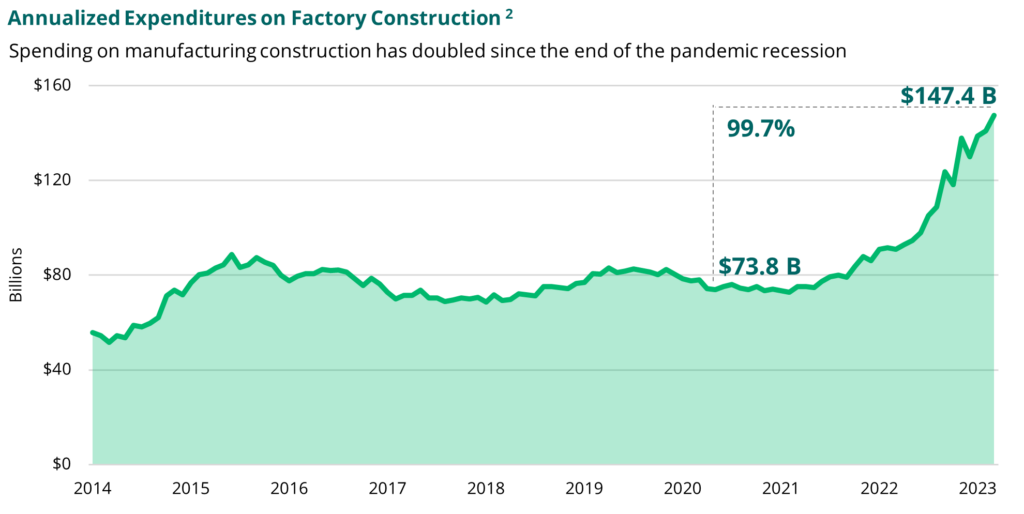
The US is experiencing a boom in factory construction, which we believe is only the beginning of a resurgence of manufacturing-driven industrial demand.
Factory construction is surging across the US amid a structural shift in supply chains that we believe is accretive to the long-term demand horizon for industrial and logistics real estate. Whether seen as efforts to “re-shore” (i.e. bring back to the US) critical-path manufacturing, capitalize on tax-efficient and fiscally-incentivized production capabilities, or create optionality in a “China-plus-one” strategy, capital expenditures have seen a meaningful leg-up in the last few years. This investment is creating multiplier effects, prompting measurable indirect and induced economic benefits experienced by parts suppliers, which are not only reshaping freight patterns but also supporting increased uptake of industrial space.
The surge in capital investment began in earnest in H2 2020, with construction spending on factories nearly doubling since then, climbing a remarkable 3.9x faster than total expenditures across all building types1. Investment in physical assets extends beyond real estate, and fixed investments increase the durable, intrinsic value of these newly-constructed assets. For example, outlays on machinery and other productive equipment have jumped 30% to near historic highs, underscoring the broad scale of expansionary activity underway as manufacturing capacity utilization remains elevated above last-cycle averages despite a stepdown in early 20232.
The modern manufacturing paradigm
New and expanded factories are landing in nearly every corner of the US, and both inland prime growth markets and tertiary markets are punching above their weight. We see lower-basis plays as an incredibly attractive portion of the opportunity set.
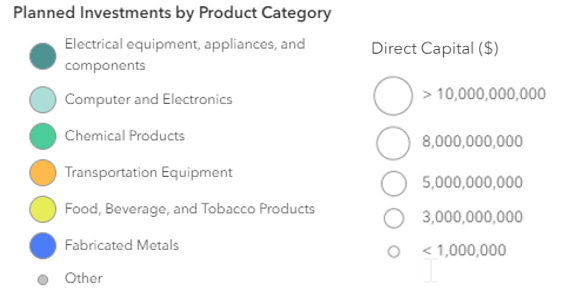
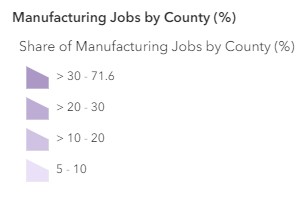
Scroll over and click on map for interactive features and additional project details.

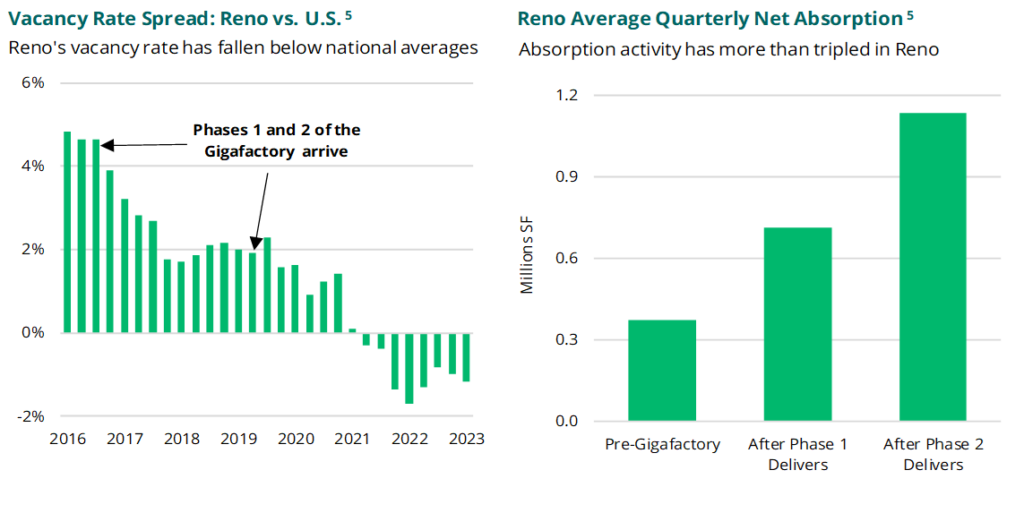
Category killers: The transformative power of Tesla in Reno, Nevada.
As the first major EV battery facility in the US, the Tesla Gigafactory in Reno demonstrates the potential transformative impact that an anchor factory can have on local industrial market dynamics. The 5.4 million SF facility has been churning out batteries since late 2016 and jumpstarted a new manufacturing ecosystem that has seen factory jobs more than double in recent years4.
Panasonic stands out as a prime example of the positive spillover effects after following Tesla to Reno as a major partner and supplier at the Gigafactory. The firm employs 4,000 local workers and represents a footprint of 730,000 SF of net-lease industrial space spread across three buildings5.
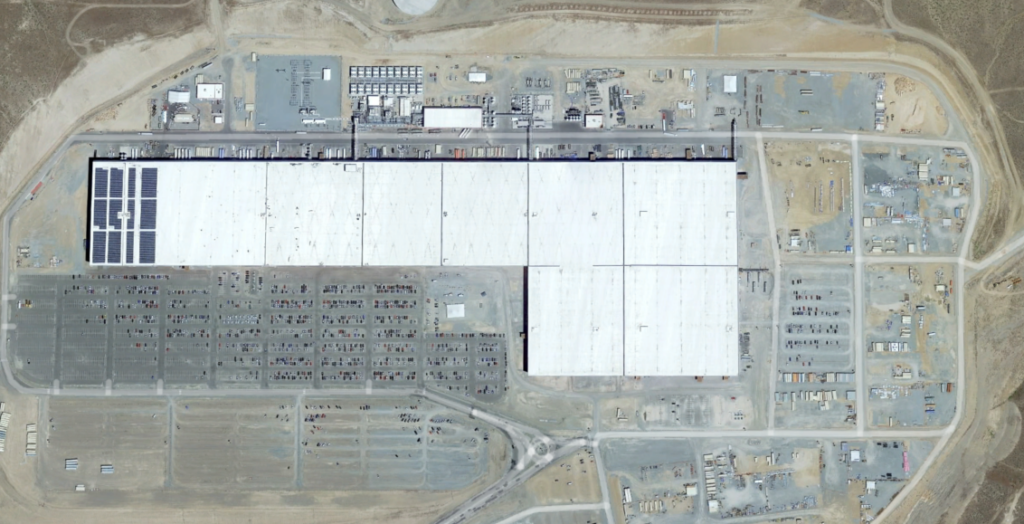
While just one example, we believe the Gigafactory illustrates how category killers can fundamentally reshape a market’s economic prospects, which, in this case, result in durable tailwinds of sustained industrial and logistics demand. To put a finer point on this, quarterly net absorption averages in Reno have jumped 3.1x since Tesla’s arrival, easily outpacing nationwide trendlines by 60%. As a result, the vacancy rate has pulled steadily downward and now stands approximately 100 bps below the national average, a stark reversal to the last business cycle that saw Reno well behind the pace of US growth5.
Why it matters
We are enthusiastic about the long-term prospects for US advanced manufacturing as domestic factory construction is booming, benefiting the long-term demand for industrial and logistics real estate. Business investments in reshoring and onshoring as well as favorable legislation are driving this trend. Regionalization in manufacturing is leading to multiplier effects, such as increased investments by vendors and parts suppliers, changes in freight patterns, and greater need for industrial space.
Sources
- US Census Bureau, Construction Spending, as of March 2023.
- US Census Bureau, Manufacturer’s Shipments, Inventories, and Orders (M3) Survey, as of March 2023. Federal Reserve of the US, Industrial Production and Capacity Utilization, as of April 2023.
- Various company statements and press releases, national and local press reports, local chambers of commerce, state economic development and other government agencies, Industry Select, Semiconductor Industry Association. Additional information can be made available upon request by emailing [email protected].
- US Bureau of Labor Statistics, State Employment and Unemployment, as of March 2023.
- CoStar, as of Q1 2023.
Map Sources
Map 1. Various company statements and press releases, national and local press reports, local chambers of commerce, state economic development and other government agencies, Industry Select, Semiconductor Industry Association, as of Apr 2023. Map 2. Various company statements and press releases, national and local press reports, local chambers of commerce, state economic development and other government agencies, Industry Select, Semiconductor Industry Association, as of Apr 2023. Moody’s Analytics Baseline Scenario, as of Q1 2023. Map 3. Various company statements and press releases, national and local press reports, local chambers of commerce, state economic development and other government agencies, Industry Select, Semiconductor Industry Association, as of Apr 2023.U.S. Census Bureau, LEHD Origin-Destination Employment Statistics (LODES), as of Q1 2023.
Disclosures
© 2023 Bridge Investment Group Holdings LLC. “Bridge Investment Group” and certain logos contained herein are trademarks owned by Bridge.
The information contained herein is for informational purposes only and is not intended to be relied upon as a forecast, research, investment advice or an investment recommendation. Reliance upon the information in this material is at the sole discretion of the reader. Past performance is not necessarily indicative of future performance or results.
This material has been prepared by the Research Department at Bridge Investment Group Holdings LLC (together with its affiliates, “Bridge”), which is responsible for providing market research and analytics internally to Bridge’s strategies. The Research Department does not issue any independent research, investment advice or investment recommendations to the general public. This material may have been discussed with or reviewed by persons outside of the Research Department.
This material does not constitute an offer to sell any securities or the solicitation of an offer to purchase any securities. This material discusses broad market, industry, or sector trends, or other general economic, market, social, legislative, or political conditions and has not been provided in a fiduciary capacity under ERISA.
Economic and market forecasts or estimated returns presented in this material reflect the Research Department’s judgement as of the date of this material and are subject to change without notice. Although certain information has been obtained from third-party sources and is believed to be reliable, Bridge does not guarantee its accuracy, completeness, or fairness. Bridge has relied upon and assumed without independent verification, the accuracy and completeness of all information available from third-party sources. Some of this information may not be freely available and may require a subscription or a payment. Any forecasts or return expectations are as of the date of material and are estimated and are based on market assumptions. These assumptions are subject to significant revision and may change materially as economic and market conditions change. Bridge has no obligation to provide updates or changes to these forecasts.
This material includes forward-looking statements that involve risk and uncertainty. Readers are cautioned not to place undue reliance on such forward-looking statements. Any reference to indices, benchmarks, or other measure of relative market performance over a specified period of time are provided for context and for your information only.