
Private Equity

Key Takeaways

Private Equity

investments

opportunities
Private equity Investment Strategies
Growth Capital
Provides funding to mature companies seeking to expand or restructure without changing control.
Distressed Investments
Target companies facing financial challenges and aim either to improve financial stability or identify and separate economically viable business units.
Fund of Funds
Invest in other PE Funds rather than directly in companies, diversifying exposure.
Private Equity as an Asset Class
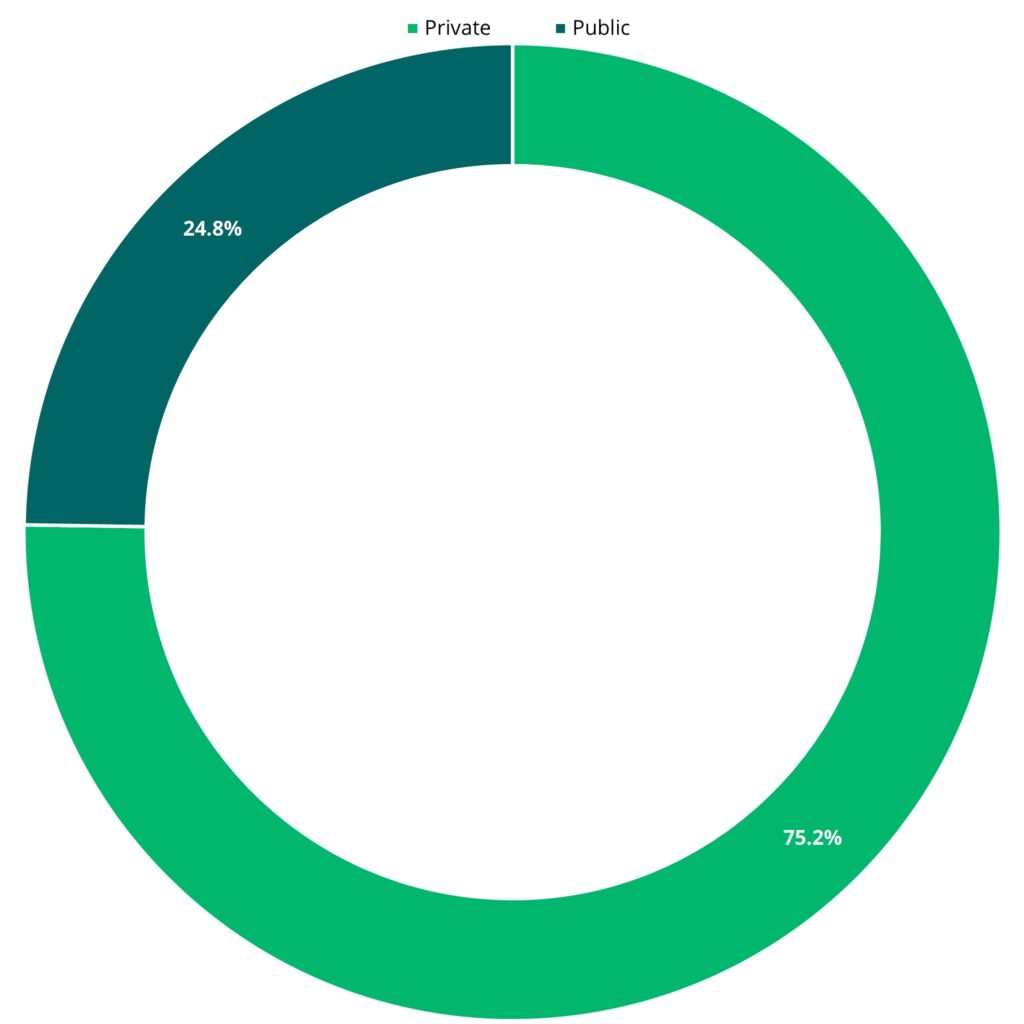
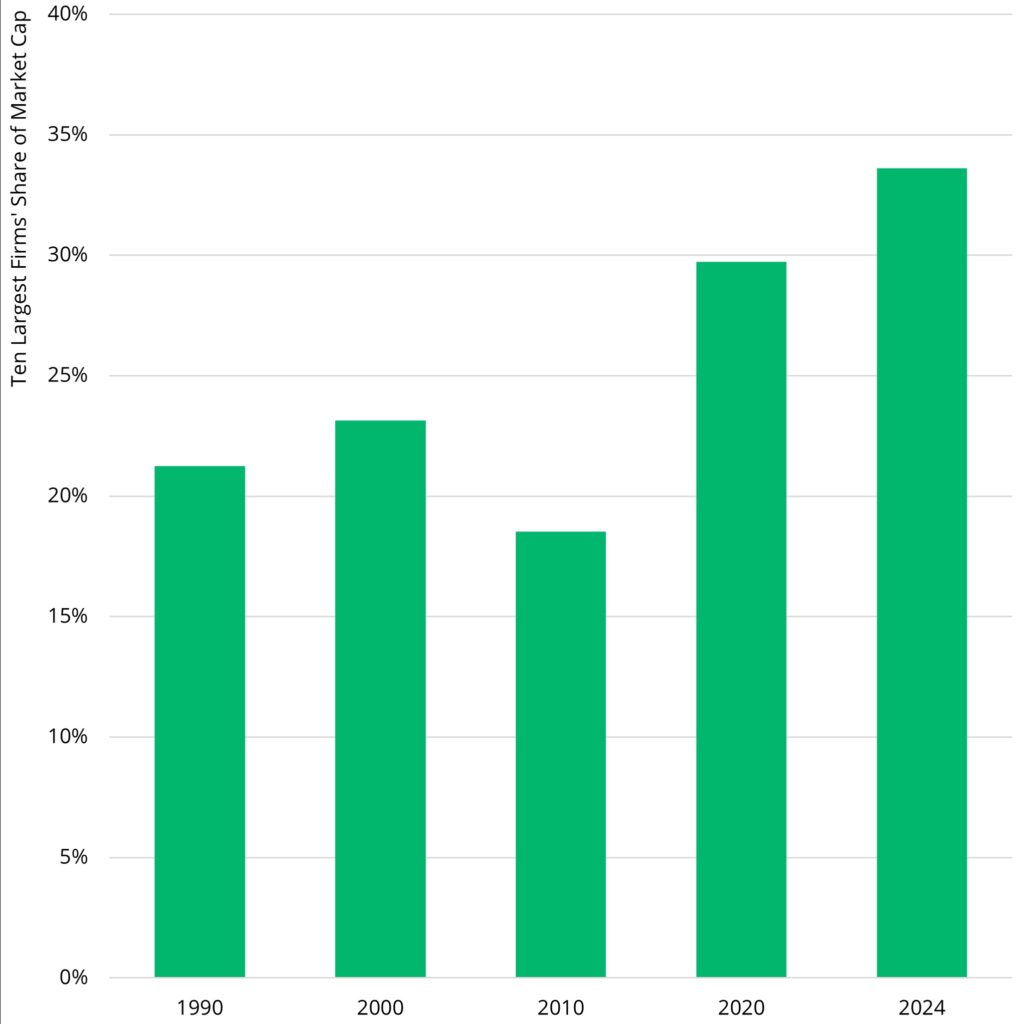
PE Funds offer exposure to a range of opportunities not accessible in public markets. In the US, three-quarters of companies that generate more than $250 million in annual revenue are privately held. However, the public equities market has become increasingly concentrated in recent years as the ten largest companies account for nearly 35% of the total market cap, almost twice the historical range of 18% to 23%.i
Nearly 75% of US Firms with $250+ Million in Revenue Are Privateii
The Seven Largest Firms Account for an Increasing Share Total Market Capiii
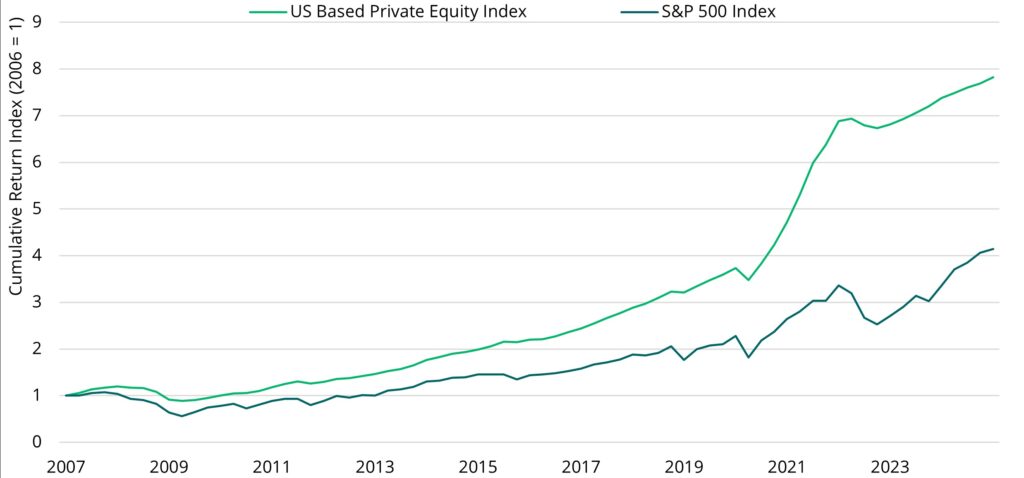
Over the long term, PE strategies have demonstrated outperformance and have delivered annual net rate of return of 12.1% since 2007, more than 388 bps higher than the returns generated in public equities markets due to earnings growth as well as asset appreciation.iv
Private Equity Has Outperformed Public Equities in Cumulative Returnsv
What Drives Value?
PE Funds conduct extensive due diligence on the financial performance and market positioning of target firms to identify attractive opportunities with untapped upside. Once the asset is acquired, the Funds have several potential levers to create value:
- Operational improvements: PE firms often introduce new efficiencies and improve management practices to reduce costs or drive growth.
- Technology and innovation: Provide capital to invest in new technologies that create a competitive edge or open up new revenue streams.
- Strategic direction: Private firms can offer expertise on optimizing capital structures, entering new sectors, or repositioning a business in a competitive market.
Private equity Secondaries
Key Takeaways
Secondaries
Private Equity Secondaries involve buying interests from the primary investors who committed directly to a PE Fund, providing flexibility and liquidity to private equity markets.
Growth
The Secondaries investment universe is rapidly growing in both breadth and depth
opportunities
Secondaries often involve investment opportunities offered at a discount with shorter hold periods and quicker positive cash flows.
What Are Private equity Secondaries Funds?
Secondaries involve buying existing PE interests from the primary investors who committed directly to a PE fund during its original rounds of capital commitments. PE Secondaries is analogous in many ways to most public stock transactions, where sellers are usually shareholders, rather than the underlying companies tied to the stock under consideration.
Most Secondary purchases generally occur in one of two different transaction types, LP-led transactions and GP-led transactions.
- An LP-led transaction involves transferring ownership of the LP’s stake in a PE Fund to a buyer in the Secondary market.
- A GP-led transaction is initiated and driven by the General Partner of a PE Fund who takes an active role in selling or restructuring the Fund’s assets, potentially providing liquidity to Limited Partners, optimizing the Fund’s portfolio, extending the Fund’s life, or addressing changes in GP ownership or management.
What are the Secular Drivers for Secondaries?
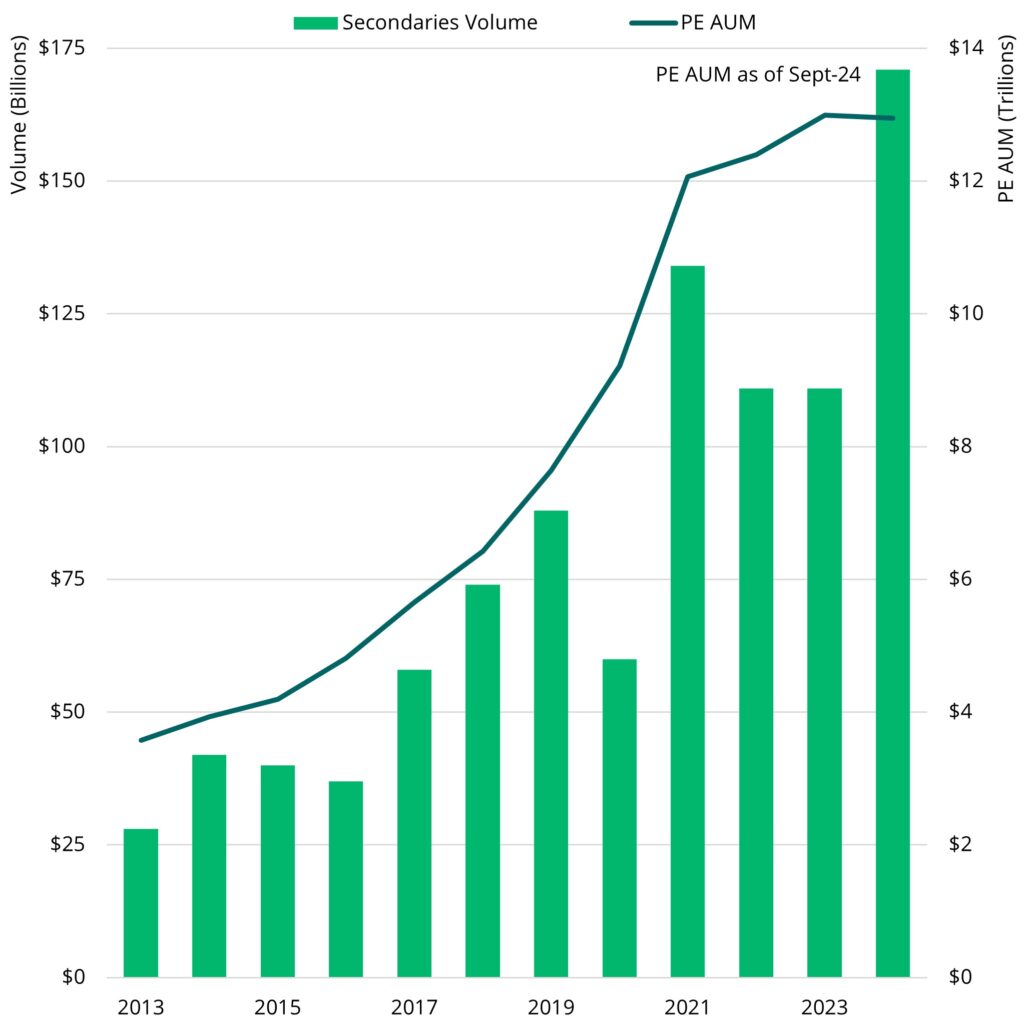
Secondaries is a rapidly growing class of PE investment that has seen annual market volume register a four-fold increase over the past decade to an annual total of $171 billion in 2024.vi Three drivers have been crucial in fueling the sector’s expansion:
Secondaries Volume and Private Equity AUMviii
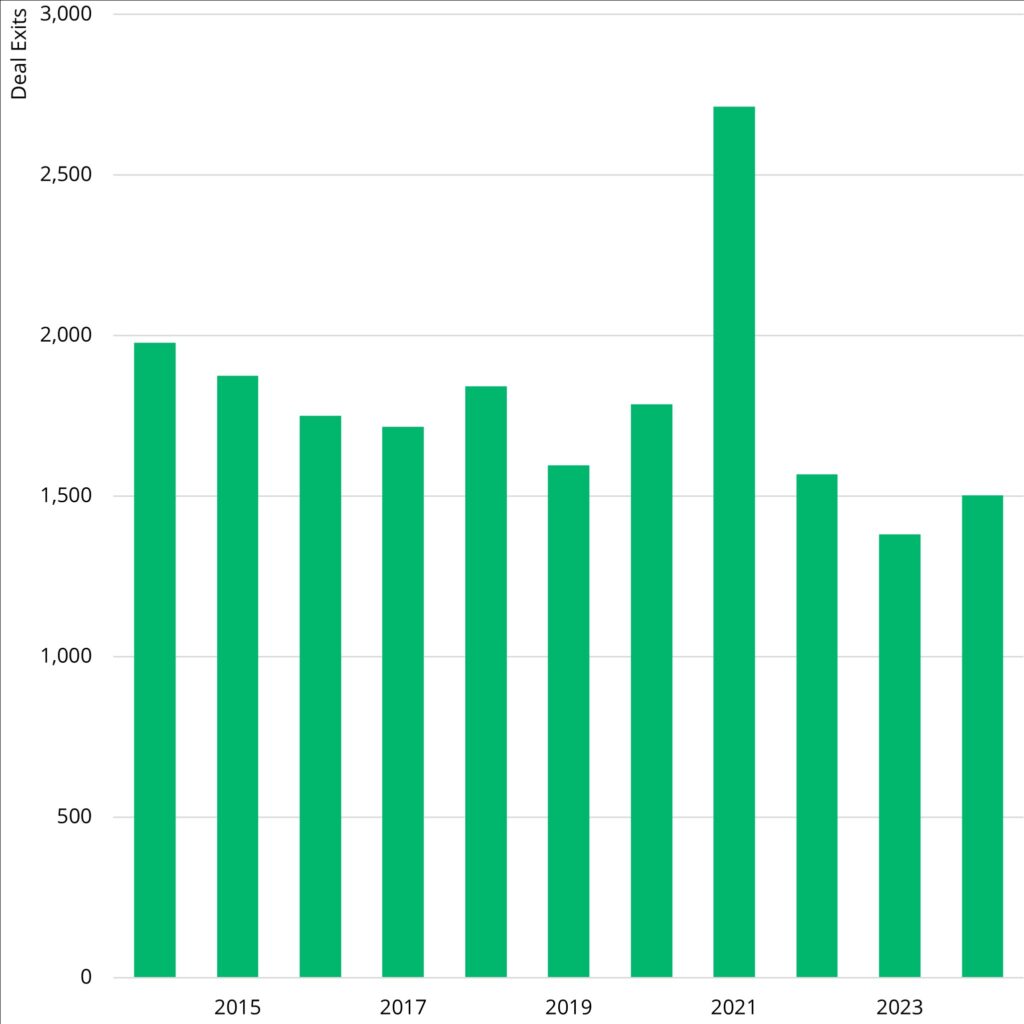
U.S. Private Equity Deal Exitsix
Secondaries as an Asset Class
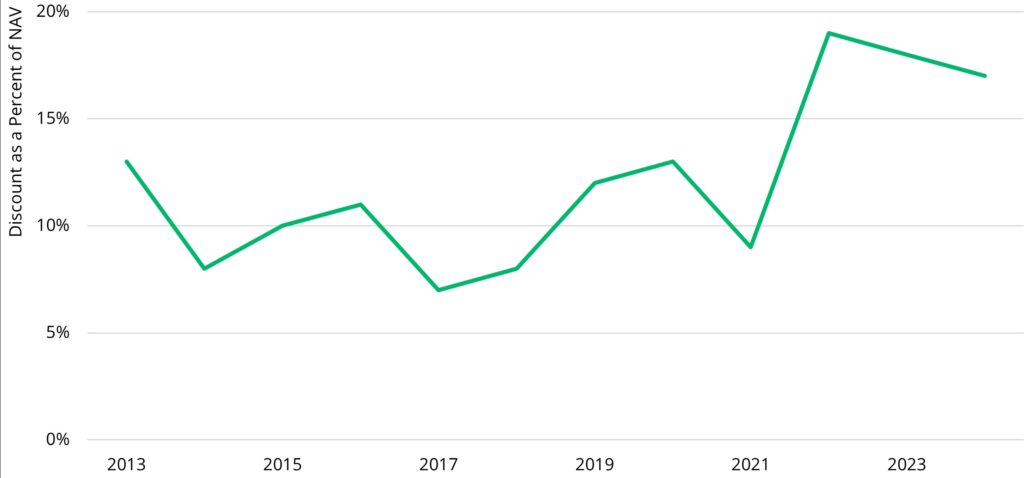
Buying at a Discount: Secondaries buyers typically acquire assets at a discount to net asset value (“NAV”) due to the seller’s need to generate liquidity or evolving investment goals. In the last three years, median Secondary purchase discounts have reached about 18% of NAV, creating immediate intrinsic value for buyers.x
Pre-Specified Pools: Secondary investors often buy interests after the PE Fund has been investing for several years, which means that many of the underlying assets have already been identified, limiting ‘blind pool’ risk. This allows for more in-depth due diligence and potentially greater confidence in expected cash flows.
Shorter Hold Periods: Secondary exposure to more mature funds also opens the door to potentially quicker positive cash flows as many of the PE funds have already worked through initial deal sourcing and are closer to the ‘harvest’ phase. This helps mitigate the J-curve effect that is typical for PE Funds and can lead to fewer capital calls.
Median Secondaries Acquisition Discount (as a Percent of NAV)xi
Explore Private Markets Further
Explore select private market asset classes to understand better what they are, who uses them, and the potential to identify value.

Explore Private Real Estate Asset Classes
Explore select private market asset classes to understand better what they are, who uses them, and the potential to identify value.


The information herein is provided for educational purposes only and should not be construed as financial or investment advice, nor should any information in this document be relied on when making an investment decision. Opinions and views expressed reflect the current opinions and views of the author(s) and Bridge Analysts as of the date hereof and are subject to change at any time without notice. Please see the end of this document for important disclosure information.
Important Disclosure Information
This material is for educational purposes only and should not be treated as research. This material may not be distributed, transmitted or otherwise communicated to others, in whole or in part, without the express written consent of Bridge Investment Group Holdings LLC (together with its affiliates, “Bridge”).
The views and opinions expressed in this material are the views and opinions of the author(s) of the material. They do not necessarily reflect the views and opinions of Bridge and are subject to change at any time without notice. Further, Bridge and its affiliates may have positions (long or short) or engage in securities transactions that are not consistent with the information and views expressed in this material. There can be no assurance that an investment strategy will be successful. Historic market trends are not reliable indicators of actual future market behavior or future performance of any particular investment which may differ materially and should not be relied upon as such. Target allocations contained herein are subject to change. There is no assurance that the target allocations will be achieved, and actual allocations may be significantly different than that shown here.
This material does not constitute an offer of any service or product of Bridge. It is not an invitation by or on behalf of Bridge to any person to buy or sell any security or to adopt any investment strategy, and shall not form the basis of, nor may it accompany nor form part of, any right or contract to buy or sell any security or to adopt any investment strategy. Nothing herein should be taken as investment advice or a recommendation to enter into any transaction.
Hyperlinks to third-party websites in this material are provided for reader convenience only. Unless otherwise noted, information included herein is presented as of the dates indicated. This material is not complete, and the information contained herein may change at any time without notice. Bridge does not have any responsibility to update the material to account for such changes. Bridge has not made any representation or warranty, expressed or implied, with respect to fairness, correctness, accuracy, reasonableness, or completeness of any of the information contained herein, and expressly disclaims any responsibility or liability, therefore. The information contained herein is not intended to provide, and should not be relied upon for, accounting, legal or tax advice or investment recommendations. Investors should make an independent investigation of the information contained herein, including consulting their tax, legal, accounting or other advisors about such information. Bridge does not act for you and is not responsible for providing you with the protections afforded to its clients.
Certain information contained herein may be “forward-looking” in nature. Due to various risks and uncertainties, actual events or results may differ materially from those reflected or contemplated in such forward-looking information. As such, undue reliance should not be placed on such information. Forward-looking statements may be identified by the use of terminology including, but not limited to, “may”, “will”, “should”, “expect”, “anticipate”, “target”, “project”, “estimate”, “intend”, “continue” or “believe” or the negatives thereof or other variations thereon or comparable terminology. Any reference to indices, benchmarks, or other measure of relative market performance over a specified period of time are provided for context and for your information only.
Past performance is not necessarily indicative of future results.
Additional information may be available upon request.
© 2025 Bridge Investment Group Holdings LLC. “Bridge Investment Group” and certain logos contained herein are trademarks owned by Bridge.
- CRE (Commercial Real Estate): Refers to properties used for business-related purposes that can generate rental income and offer potential upside through capital appreciation.
- Limited Partner (LP): An investor in a business who does not actively manage the day-to-day operations. LPs are also known as “silent partners” or “passive investors”.
- General Partner (GP): The managing entity or individual responsible for overseeing and operating an investment, typically within private equity, venture capital, or real estate private equity structures.
- J-Curve Effect: Refers to the typical trajectory of private investment returns, where initial, short-term losses due to upfront costs are followed by a long-term improvement in performance.
- Net Asset Value (NAV): Represents the total value of an entity’s assets minus its liabilities, commonly used to measure the per-share value of an investment vehicle such as a mutual fund, real estate fund, or private equity fund.
- Blind Pool Risk: The risk associated with committing capital to a fund or investment vehicle—commonly in private equity or real estate—before the fund has identified or acquired specific assets.
i Bloomberg, as of April 15, 2025.
ii S&P Capital IQ, as of April 15, 2025.
iii Bloomberg, as of April 15, 2025.
iv Preqin, US Based Private Equity Index, as of Q4 2024. Bloomberg, SPX Index, Q4 2024 as of Q1 2025.
v Preqin, US Based Private Equity Index, as of Q4 2024. Bloomberg, SPX Index, Q4 2024 as of Q1 2025.
vi Greenhill, Global Secondary Market Review Full Year 2024, as of April 2025.
vii Greenhill, Global Secondary Market Review Full Year 2024, as of April 2025. Preqin, as of Jun 2023.
viii Greenhill, Global Secondary Market Review Full Year 2024, as of April 2025.
ix Preqin, as of April 2025.
x Greenhill, Global Secondary Market Review Full Year 2024, as of April 2025.
xi Greenhill, Global Secondary Market Review Full Year 2024, as of April 2025.
ON THIS PAGE…