

Multifamily Transactions — Looking Beneath the Headline Recovery
Key Takeaways
Multifamily transactions are improving, but the recovery remains uneven, with headline volume recovering faster than the number of properties changing hands.
Improving credit availability is creating a more supportive environment for multifamily deal activity, as originations rise and depositories and CMBS lenders become more active.
Elevated rates and compressed cap-rate spreads remain key counterweights to a broader multifamily recovery, while upcoming debt maturities add pressure to existing capital structures.
Volume vs. Transaction Count — The Gap Between Dollars and Deals
U.S. CRE transaction activity has moved closer to pre-pandemic levels, but the recovery remains uneven. This is particularly evident within multifamily: headline dollar volume suggests the sector has largely recovered, while the underlying data tell a more nuanced story. Looking ahead, we believe several capital-market tailwinds and headwinds will help shape the extent and pace of further recovery.
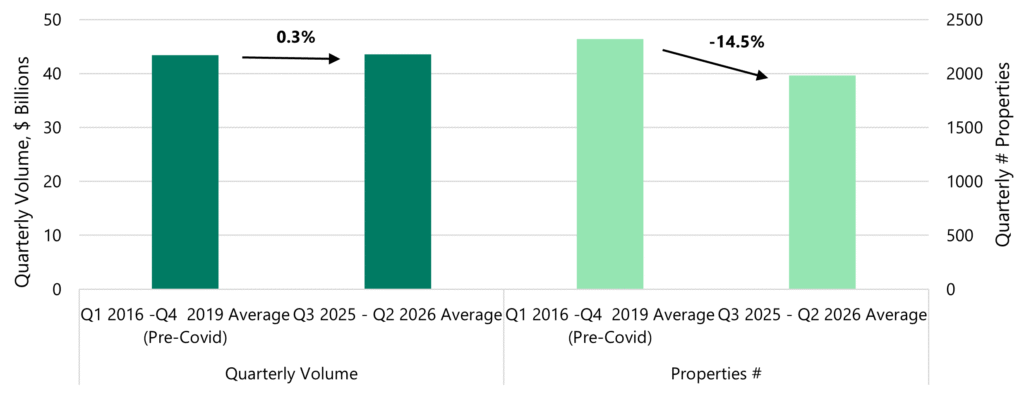
Multifamily transaction activity is recovering, but dollar volume has rebounded faster than the number of properties trading. This divergence partly reflects higher asset values, with median pricing per unit rising 34%, from $133,000 in 2016–2019 to $178,000 over the past year.1 As a result, fewer properties are generating comparable dollar volume, suggesting headline figures may overstate the breadth of market activity. A recovery driven by appreciation and larger deals differs from one in which transaction counts recover proportionally.
Financing as a Catalyst — Lending Is Opening Up
Against this backdrop, improving financing conditions and increased lender activity are creating a more supportive environment for multifamily transactions. The Federal Reserve’s July 2026 Senior Loan Officer Opinion Survey showed that banks generally eased CRE lending standards, a notable shift from July 2025, when banks reported tighter standards across CRE loans.2 While standards remain historically tight, the recent easing signals a more supportive lending environment.
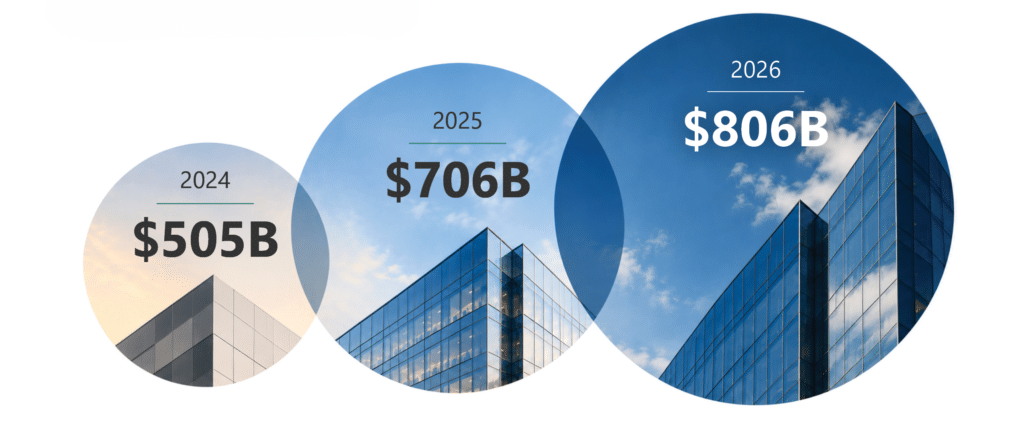
Origination volumes reinforce this trend. Commercial and multifamily mortgage originations rose 52% year-over-year in Q1 2026 and 16% in Q2. CMBS and depositories supported the increase, with Q2 originations up 68% and 61% YoY, respectively. This momentum is expected to continue, with the Mortgage Bankers Association forecasting $806 billion in total commercial mortgage originations in 2026, approximately 14% above the 2025 total and 60% above 2024.3 While refinancing tied to upcoming maturities contributes to overall volumes, higher originations still point to greater lender participation and broader financing activity.
Remaining Headwinds — Rates and Refinancing Pressure
Despite improving availability, CRE debt remains expensive, with elevated benchmark rates continuing to weigh on borrowing costs. Furthermore, as of October 2026, the 10-year Treasury yield has climbed above 5%, well above the 3.8% median level at which CBRE survey respondents indicated a notable increase in CRE sales activity would occur.4,5 Multifamily cap rates have increased since 2022 but have not kept pace with the move in Treasury yields, leaving the yield premium well below pre-2022 levels.6 Compressed spreads can reduce leverage benefits and limit transactions that meet investor return requirements.
Refinancing pressure adds another dimension to the outlook. Approximately $757 billion of multifamily debt is scheduled to mature from 2026-2028, requiring many owners to refinance in a higher-rate environment.7 Higher refinancing costs and potentially tighter loan proceeds could require additional equity, exacerbating pressure on challenged capital structures.
Multifamily Transaction Volume Is Recovering, While Individual Sales Continue to Lag8
The Path Forward — A Gradual and Selective Recovery
The multifamily transaction recovery is real but uneven. Improving financing conditions and rising origination volumes are constructive, yet elevated rates and compressed spreads mean the gap between performing and underperforming assets is widening, not narrowing. In this environment, headline volume recovery is less relevant than the ability to source transactions with durable NOI growth, manage through near-term debt maturities, and deploy capital selectively. The path forward favors operators with the underwriting discipline and balance sheet flexibility to act where others cannot.
Commercial Mortgage Originations9
Multifamily Yield Spreads Remain Well Below Pre-2022 Levels10
1 RCA, as of Q2 2026.
2 Board of Governors of the Federal Reserve System, Senior Loan Officer Opinion Survey, July 2026 & July 2025.
3 MBA, MBA Annual Report Finds Total Commercial Real Estate Borrowing and Lending Increased by 40 Percent in 2025, April 28, 2026. MBA, MBA CREF Forecast: Total Commercial Mortgage Originations to Increase 27 Percent to $805 Billion in 2026, February 9, 2026.
4 Board of Governors of the Federal Reserve System (US), Market Yield on U.S. Treasury Securities at 10-Year Constant Maturity, via FRED, October 8, 2026.
5 CBRE, U.S. Cap Rate Survey H1 2026, August 12, 2026.
6 RCA, Quarterly Caps, Yields & Spreads, as of August 2026. Bloomberg, as of October 8, 2026. Monthly Treasury yields represent the average of available daily observations within each calendar month.
7 The Wall Street Journal, Apartment Landlords Have a $2 Trillion Debt Problem That Is Only Getting Worse, September 21, 2026.
8 RCA, as of Q2 2026.
9 MBA, MBA Annual Report Finds Total Commercial Real Estate Borrowing and Lending Increased by 40 Percent in 2025, April 28, 2026. MBA, MBA CREF Forecast: Total Commercial Mortgage Originations to Increase 27 Percent to $805 Billion in 2026, February 9, 2026.
10 RCA, Quarterly Caps, Yields & Spreads, as of August 2026. Bloomberg, as of October 8, 2026. Monthly Treasury yields represent the average of available daily observations within each calendar month.
subscribe to our market outlooks and sector insights
Disclosures
THIS IS NOT AN OFFER OF BRIDGE’S INVESTMENT ADVISORY SERVICES AND IS NEITHER AN OFFER TO SELL NOR A SOLICITATION OF AN OFFER TO BUY ANY SECURITIES. AN OFFERING IS MADE ONLY BY A PROSPECTUS OR PRIVATE PLACEMENT MEMORANDUM.
This material may not be distributed, transmitted or otherwise communicated to others, in whole or in part, without the express written consent of Bridge Investment Group Holdings, LLC, or any of its subsidiaries (“Bridge”). This information does not constitute an offer to sell or the solicitation of an offer to buy, any security, product or service, including investment vehicles or strategies managed by Bridge. Hyperlinks to third-party websites are provided for reader convenience only.
The views and opinions expressed are for informational and educational purposes only as of the date of this Report and may change without notice at any time based on numerous factors, such as market or other conditions, legal and regulatory developments, additional risks and uncertainties and may not come to pass. The information provided herein is based on the views and opinions of Bridge Analysts. As such, the analysis is based on certain assumptions which are subject to change without notice.
Bridge has not made any representation or warranty, expressed or implied, with respect to fairness, correctness, accuracy, reasonableness or completeness of any of the information contained herein (including not limited to information obtained from third parties unrelated to Bridge) and they expressly disclaim any responsibility or liability, therefore. The information contained herein is not intended to provide and should not be relied upon for accounting, legal or tax advice or investment recommendations. Investors should make an independent investigation of the investment described herein, including consulting their tax, legal, accounting or other advisors, about the matters discussed here. There can be no assurances that any of the trends described herein will continue or will not reverse. Past events and trends do not imply, predict, or guarantee, and are not necessarily indicative of future events or results.
Investing involves risk, including loss of principal. Alternative investments often are speculative, typically have higher fees than traditional investments, often include a high degree of risk and are appropriate only for eligible, long-term investors who are willing to forgo liquidity and put capital at risk for an indefinite period of time. They may be highly illiquid and can engage in leverage and other speculative practices that may increase volatility and risk of loss.
Past performance is not indicative nor a guarantee of future results.
Certain information contained herein may be “forward-looking” in nature. Due to various risks and uncertainties, actual events or results or the actual performance of a Fund may differ materially from those reflected or contemplated in such forward-looking information. As such, undue reliance should not be placed on such information. Forward-looking statements may be identified by the use of terminology including, but not limited to, “may,” “will,” “should,” “expect,” “anticipate,” “target,” “project,” “estimate,” “intend,” “continue” or “believe” or the negatives thereof or other variations thereon or comparable terminology.
All rights to the trademarks and/or logos presented herein belong to their respective owners and Bridge’s use hereof does not imply an affiliation with, or endorsement by, the owners of these logos. This material may contain select images that are provided for illustrative purposes only and may not be representative of assets owned or managed by Bridge. Such images may include digital renderings or stock photos rather than actual photos of assets, residents or communities.
Apollo Global Securities, LLC (“AGS”) and Griffin Capital Securities, LLC (“GCS”), Members of FINRA and SIPC, are subsidiaries of Apollo Global Management, Inc (“Apollo”). AGS conducts Apollo’s capital markets business and certain of its product marketing and distribution, and GCS is a wholesale marketing agent for Apollo sponsored products.
Recipients may only use this material to the extent permitted by the applicable laws and regulations and should be aware of and observe all such applicable laws and regulations. This material and the transactions, investments, products, services, securities or other financial instruments referred to herein are not directed to, or intended for distribution to or use by, any person or entity who is a citizen or resident of or located in any locality, state, country or other jurisdiction where such distribution, publication, availability or use would be contrary to any laws or regulations. Distribution of additional information may be restricted in certain jurisdictions.
Additional information may be available upon request.
© 2026 Bridge Investment Group Holdings LLC. All Rights Reserved.
BGRT-20261013-5987861-19125846