

U.S. Commercial Real Estate Is Inexpensive Relative to U.S. Equities
Executive Summary
Based on Q3 2025 cross‑asset comparisons, we believe U.S. CRE appears inexpensive relative to major U.S. equity indices, creating a potential attractive entry point as fundamentals firm and financial conditions ease.
CRE appears to offer strong relative value vs. equities. Converting cap rates to implied “earnings multiples,” core sectors like industrial (~16x) and multifamily (~18x) sit below the S&P 500 (~28x) and Nasdaq 100 (~37x) as of Q3 2025.
Why the gap widened. In 2025, equities priced in tech/AI optimism, while CRE values were anchored by lower sales volumes and higher financing/refinancing costs.
U.S. Commercial Real Estate Is Inexpensive Relative to Equities
We believe U.S. commercial real estate (CRE) appears inexpensive relative to major U.S. equity indices.
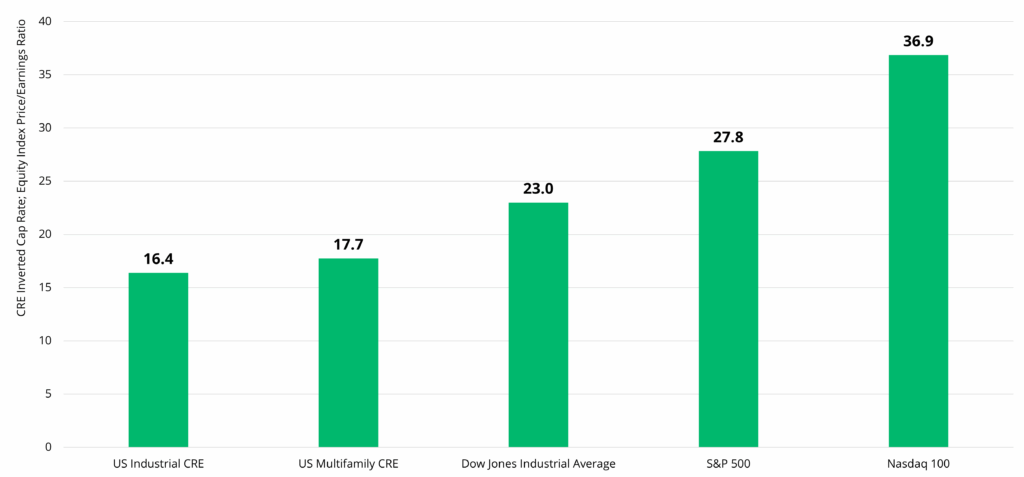
By inverting real estate capitalization rates (cap rates) to “earnings multiples,” we can compare commercial real estate with public equities P/E (price-to-earnings) ratio for approximate comparisons1. Using average cap rates from the third quarter of 2025, we see potential signs of differentiation: sectors such as multifamily and industrial have meaningfully lower implied multiples than the S&P 500 or Nasdaq 100 as of Q3 2025.
U.S. industrial properties average around a 6.1% cap rate2—an implied multiple of ~16x. Multifamily averages near a 5.6% cap rate, or ~18x. Public equity indices’ P/E values are higher: for Q3 2025, the S&P 500 was ~28x trailing P/E, the Nasdaq 100 near 37x, and even the Dow Jones Industrial Average—arguably the most value‑oriented major index—near 23x (see accompanying visual).3
The divergence between CRE and public equity indices widened in 2025. We believe public equities have benefited from optimism around technology‑led productivity gains—and particularly notable is the extreme concentration of AI in the S&P 5004. On the other hand, U.S. CRE valuations remained anchored by lower sales volumes and elevated refinancing activities in a higher interest rate environment.
We believe CRE offers attractive value, especially as fundamentals across many property types are resilient and are improving. For example, multifamily occupancy appears poised to improve after late cycle downward pressure, and we see similar signs of improvement in certain segments of the logistics and industrial sector. As financial conditions ease and liquidity returns to commercial real estate markets, we believe that relative value—particularly in multifamily and industrial—presents a compelling opportunity to engage capital into real assets.
Sectors of U.S. CRE Potentially Offer Strong Relative Value to U.S. Equities5
1 Comparisons convert commercial real estate cap rates into implied earnings multiples (1/cap rate) to align with equity P/E. Note, metrics are not perfectly comparable due to differences in NOI, leverage, liquidity, growth, and risk. Results are illustrative and limited to the period stated above.
2 MSCI Real Capital Analytics’ cap rates include refinance transactions and exclude portfolio transactions.
3 Bloomberg, as of November 4, 2025. The equity indices P/E ratios represent average values for Q3 2025 and are calculated for indices as Last Price divided by Trailing 12M Diluted EPS from Cont Ops (Bloomberg RR900).
4 See in particular: Sløk, T. (2025, September 16). Equity investors are dramatically overexposed to AI. Apollo Academy. https://www.apolloacademy.com/equity-investors-are-dramatically-over-exposed-to-ai/; and Sløk, T. (2025, September 8). Extreme Concentration in the S&P 500. Apollo Academy. https://www.apolloacademy.com/extreme-concentration-in-the-sp-500-3/
5 MSCI Real Capital Analytics, as of Q3 2025. Bloomberg, as of November 4, 2025.
subscribe to our market outlooks and sector insights
Disclosures
This material is for educational purposes only and should not be treated as research. This material may not be distributed, transmitted or otherwise communicated to others, in whole or in part, without the express written consent of Bridge Investment Group Holdings LLC (together with its affiliates, “Bridge”).
The views and opinions expressed in this material are the views and opinions of the author(s) of the material. They do not necessarily reflect the views and opinions of Bridge and are subject to change at any time without notice. Further, Bridge and its affiliates may have positions (long or short) or engage in securities transactions that are not consistent with the information and views expressed in this material. There can be no assurance that an investment strategy will be successful. Historic market trends are not reliable indicators of actual future market behavior or future performance of any particular investment which may differ materially and should not be relied upon as such. Target allocations contained herein are subject to change. There is no assurance that the target allocations will be achieved, and actual allocations may be significantly different than that shown here.
This material does not constitute an offer of any service or product of Bridge. It is not an invitation by or on behalf of Bridge to any person to buy or sell any security or to adopt any investment strategy, and shall not form the basis of, nor may it accompany nor form part of, any right or contract to buy or sell any security or to adopt any investment strategy. Nothing herein should be taken as investment advice or a recommendation to enter into any transaction.
Hyperlinks to third-party websites in this material are provided for reader convenience only. Unless otherwise noted, information included herein is presented as of the dates indicated. This material is not complete, and the information contained herein may change at any time without notice. Bridge does not have any responsibility to update the material to account for such changes. Bridge has not made any representation or warranty, expressed or implied, with respect to fairness, correctness, accuracy, reasonableness, or completeness of any of the information contained herein, and expressly disclaims any responsibility or liability, therefore. The information contained herein is not intended to provide, and should not be relied upon for, accounting, legal or tax advice or investment recommendations. Investors should make an independent investigation of the information contained herein, including consulting their tax, legal, accounting or other advisors about such information. Bridge does not act for you and is not responsible for providing you with the protections afforded to its clients.
Certain information contained herein may be “forward-looking” in nature. Due to various risks and uncertainties, actual events or results may differ materially from those reflected or contemplated in such forward-looking information. As such, undue reliance should not be placed on such information. Forward-looking statements may be identified by the use of terminology including, but not limited to, “may”, “will”, “should”, “expect”, “anticipate”, “target”, “project”, “estimate”, “intend”, “continue” or “believe” or the negatives thereof or other variations thereon or comparable terminology. Any reference to indices, benchmarks, or other measure of relative market performance over a specified period of time are provided for context and for your information only.
All rights to the trademarks and/or logos presented herein belong to their respective owners and Bridge’s use hereof does not imply an affiliation with, or endorsement by, the owners of these logos. This material may contain select images that are provided for illustrative purposes only and may not be representative of assets owned or managed by Bridge. Such images may include digital renderings or stock photos rather than actual photos of assets, residents or communities.
Past performance is not necessarily indicative of future results.
Additional information may be available upon request.
© 2025 Bridge Investment Group Holdings LLC. All Rights Reserved.
BGRT-20251110-4978855-15689522