

Residential Rental Demand Sustained by the Persistent Unaffordability of Homeownership
Executive Summary
Higher buying costs and fewer affordable options are keeping would‑be buyers in rentals. We believe multifamily occupancy rates could achieve high levels in many markets across the U.S.
Owning a home has gotten pricier. Home prices, mortgage rates, insurance, and taxes have all risen materially. At the same time, affordability protections on roughly 900,000 income‑restricted apartments are set to expire by 2033, pushing more households into residential rental.
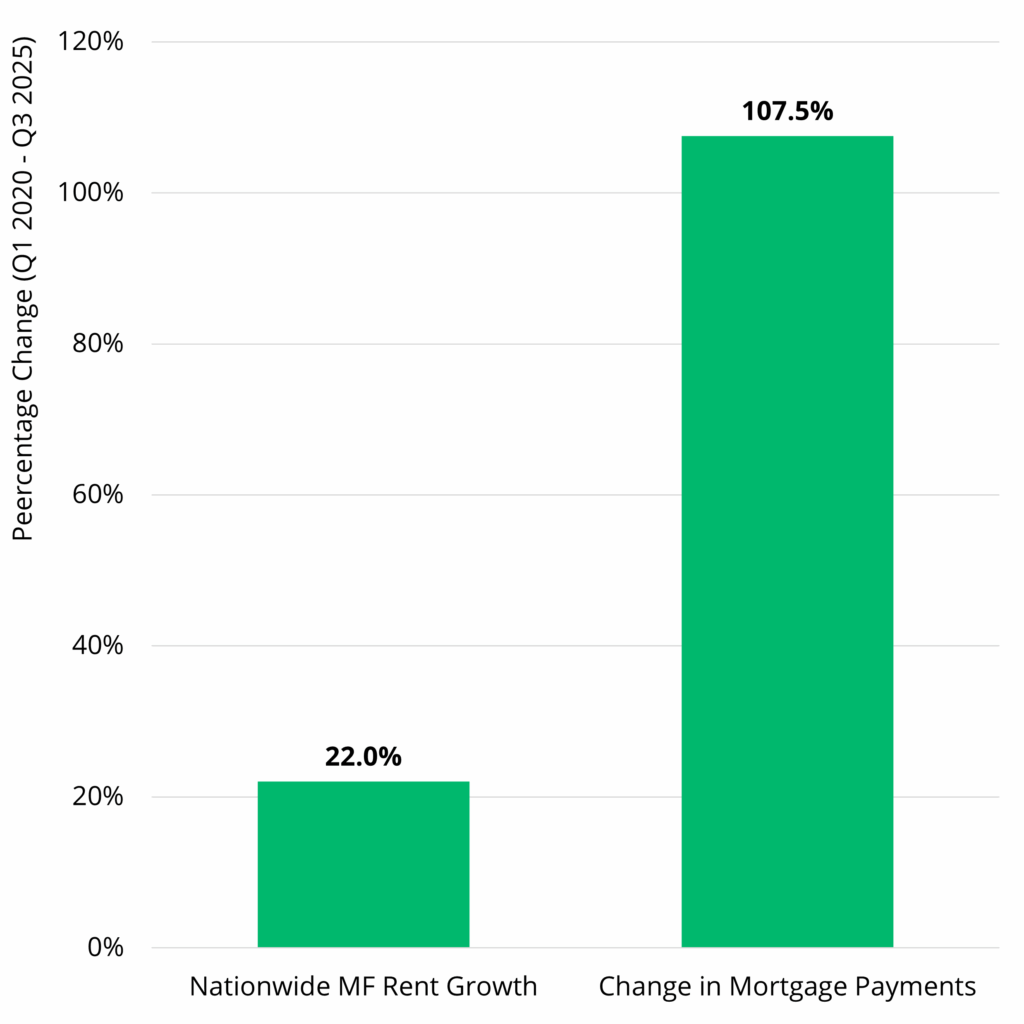
More renters, longer tenures. From 2021–2023, the U.S. added about 1.5 million renter households. Since early 2020, average rents are up ~22%, while typical mortgage payments have more than doubled, widening the monthly cost gap.
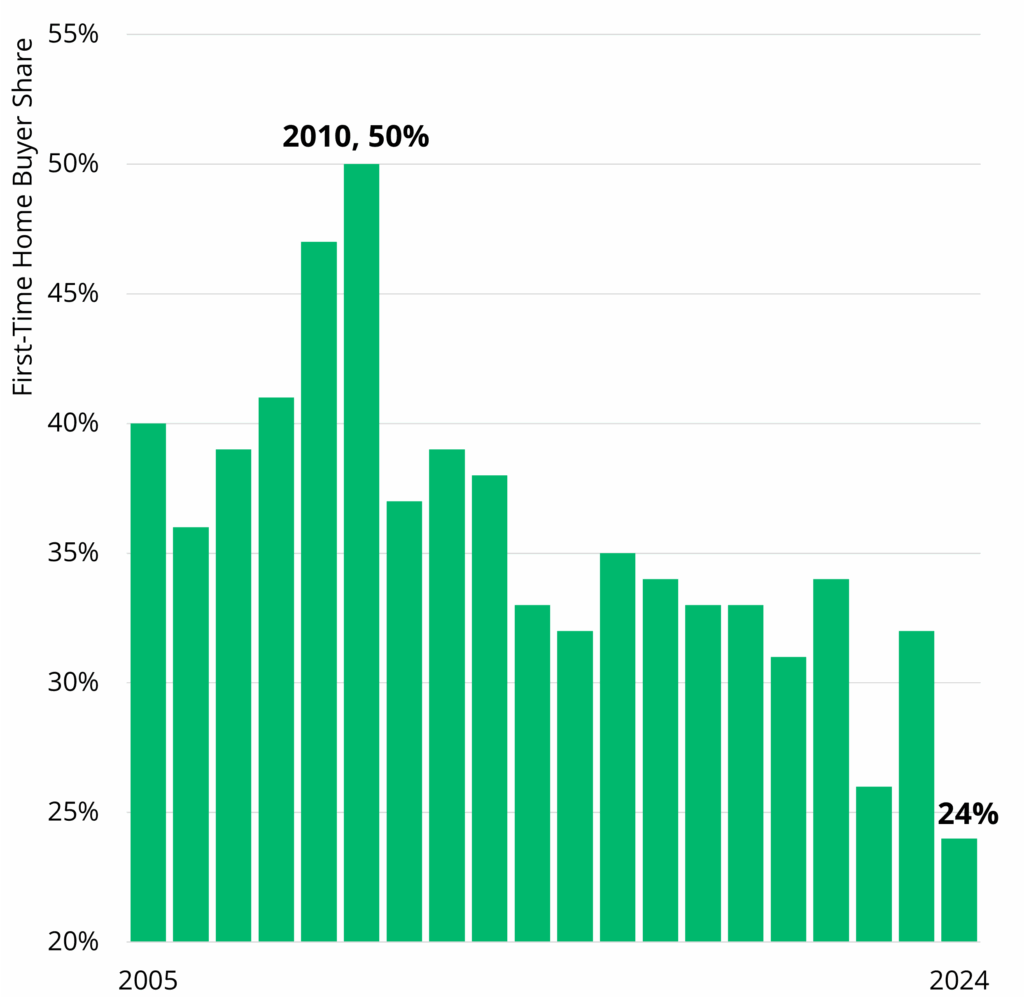
The Result? Fewer first‑time buyers. Only 24% of recent home purchases were by first‑timers, and the median first‑time buyer is 38 years old, both historic records—a sign that many households are delaying ownership.
Residential Rental Demand Sustained by the Persistent Unaffordability of Homeownership
Homeownership has become increasingly” less attainable over the past several years. As a result, millions of U.S. renter households cannot afford the median‑priced home in their local market, and the pipeline of would‑be buyers continues to thin. We believe this affordability shock is not transitory; it is embedded in both sides of the attainability equation—restricted supply of affordable options and elevated all‑in costs of owning relative to renting.
On the supply side, affordability protections for subsidized rental housing are rolling off. Roughly 900,000 affordability restrictions are scheduled to expire by year‑end 2033,1 shrinking the stock of regulated units and pushing more households into the market‑rate rental pool. Newly constructed affordable housing may, in our view, offset the sunsetting of protections, but only to a degree—and not enough to make forward progress.
On the demand side, the cost of accessing homeownership remains increasingly high versus renting, with higher home prices, elevated mortgage rates, insurance inflation, and rising taxes observed in many metros. We view this as contributing to a widening and persistent “rent‑versus‑own” gap that keeps households in rental tenure longer.
Household formation appears to support this trend. Approximately 1.5 million renter households were formed between 2021 and 2023, according to the latest U.S. Census data—about three times the growth observed between 2015 and 2019.2 While many of these new renter households faced rents that have increased 22% since the beginning of 2020, during the same period mortgage payments more than doubled.3
Market activity hints at how the story is evolving. First‑time homebuyers represent just 24% of transactions, the lowest share since tracking began in 1981, while the median age of first‑time buyers has climbed to 38 in 2024, the highest on record.4 Both indicators point to delayed entry into ownership and extended rental duration.
Bottom line: With more renter households unable to bridge the affordability gap to ownership, we believe multifamily occupancy rates could achieve levels above historical averages in many markets across the U.S. This supports our high thematic conviction for residential rental broadly while also reinforcing the attractive investment characteristics of well‑located, institutionally managed rental housing.
Share of First-Time Home Buyers at a Record Low5
Accessing the Homeownership Market Is Prohibitively Expensive6
1 National Housing Preservation Database. Public and Affordable Housing and Research Corporation and the National Low Income Housing Coalition, 2024 Picture of Preservation, December 2024.
2 U.S. Census Bureau, American Community Survey, 1-Year Estimates, 2023.
3 RealPage, as of Q3 2025. Moody’s Analytics and Bloomberg, as of October 2025. Mortgage calculations are based upon median existing home prices between 2020 and 2025.
4 National Association of Realtors, Profile of Home Buyers and Sellers, 2024.
5 National Association of Realtors, Profile of Home Buyers and Sellers, 2024.
6 RealPage, as of Q3 2025. Bloomberg, Moody’s Analytics, and National Association of Realtors, as of October 2025. Mortgage payments are calculated using median existing home prices and Freddie Mac 30 Year Fixed Mortgage Rate.
subscribe to our market outlooks and sector insights
Disclosures
This material is for educational purposes only and should not be treated as research. This material may not be distributed, transmitted or otherwise communicated to others, in whole or in part, without the express written consent of Bridge Investment Group Holdings LLC (together with its affiliates, “Bridge”).
The views and opinions expressed in this material are the views and opinions of the author(s) of the material. They do not necessarily reflect the views and opinions of Bridge and are subject to change at any time without notice. Further, Bridge and its affiliates may have positions (long or short) or engage in securities transactions that are not consistent with the information and views expressed in this material. There can be no assurance that an investment strategy will be successful. Historic market trends are not reliable indicators of actual future market behavior or future performance of any particular investment which may differ materially and should not be relied upon as such. Target allocations contained herein are subject to change. There is no assurance that the target allocations will be achieved, and actual allocations may be significantly different than that shown here.
This material does not constitute an offer of any service or product of Bridge. It is not an invitation by or on behalf of Bridge to any person to buy or sell any security or to adopt any investment strategy, and shall not form the basis of, nor may it accompany nor form part of, any right or contract to buy or sell any security or to adopt any investment strategy. Nothing herein should be taken as investment advice or a recommendation to enter into any transaction.
Hyperlinks to third-party websites in this material are provided for reader convenience only. Unless otherwise noted, information included herein is presented as of the dates indicated. This material is not complete, and the information contained herein may change at any time without notice. Bridge does not have any responsibility to update the material to account for such changes. Bridge has not made any representation or warranty, expressed or implied, with respect to fairness, correctness, accuracy, reasonableness, or completeness of any of the information contained herein, and expressly disclaims any responsibility or liability, therefore. The information contained herein is not intended to provide, and should not be relied upon for, accounting, legal or tax advice or investment recommendations. Investors should make an independent investigation of the information contained herein, including consulting their tax, legal, accounting or other advisors about such information. Bridge does not act for you and is not responsible for providing you with the protections afforded to its clients.
Certain information contained herein may be “forward-looking” in nature. Due to various risks and uncertainties, actual events or results may differ materially from those reflected or contemplated in such forward-looking information. As such, undue reliance should not be placed on such information. Forward-looking statements may be identified by the use of terminology including, but not limited to, “may”, “will”, “should”, “expect”, “anticipate”, “target”, “project”, “estimate”, “intend”, “continue” or “believe” or the negatives thereof or other variations thereon or comparable terminology. Any reference to indices, benchmarks, or other measure of relative market performance over a specified period of time are provided for context and for your information only.
All rights to the trademarks and/or logos presented herein belong to their respective owners and Bridge’s use hereof does not imply an affiliation with, or endorsement by, the owners of these logos. This material may contain select images that are provided for illustrative purposes only and may not be representative of assets owned or managed by Bridge. Such images may include digital renderings or stock photos rather than actual photos of assets, residents or communities.
Past performance is not necessarily indicative of future results.
Additional information may be available upon request.
© 2025 Bridge Investment Group Holdings LLC. All Rights Reserved.
GWMS,20251022-4913355-15520935