

U.S. E-Commerce Is a Durable Driver of Logistics Demand
Executive Summary
Online sales are outpacing stores, and we believe demographics and sticky consumer behavioral shifts are durable tailwinds that will continue to shape U.S. commercial real estate in favor of modern logistics asset infrastructure that facilitate evolving consumer trends.
Structural shifts in demand: Over the past decade, U.S. e‑commerce grew ~14% annually versus ~4% for brick‑and‑mortar retail1—a sign of a secular shift in how Americans shop.
Demographic tailwinds: Young adults are driving the gains. Millennials make more digital purchases than any other generation (32% shopping online-only).2 Gen Z is mobile‑first, and their aggregate spending rose by over 50% since 2019,3 reinforcing e‑commerce’s tailwinds.
Sticky post‑pandemic behaviors: Expectations for speed and convenience are rising; at the same time, the ways consumers shop through e-commerce channels is fundamentally different with the average return rates of nearly 25% for e‑commerce vs. over 8% in‑store.4
Implications for industrial real estate: Returns processing, inventory decentralization, and last‑mile optimization can increase logistics intensity, which in our view drives demand for more facilities closer to end demand with higher throughput.
U.S. E‑Commerce Is a Durable Driver of Logistics Demand
Over the past decade, e-commerce grew more than three times faster than traditional retail5
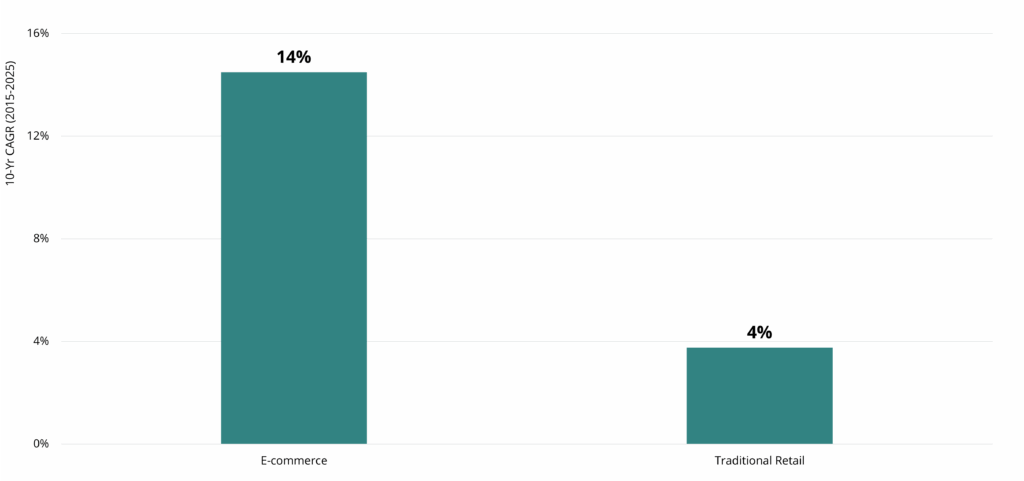
The growth of U.S. e‑commerce is driven by powerful demographic tailwinds and shifting consumer preferences, which we believe serve as a durable engine of U.S. logistics demand. Over the past decade, online sales compounded at ~14% annually, versus ~4% for traditional brick‑and‑mortar retail (see visual below). In our view, this secular trend is not cyclical but is instead a significant shift in how Americans shop.
Who is fueling the increased growth? Young adults. Millennials make more digital purchases than any other generation (32% shopping online-only), and Gen Z is mobile‑first, seamlessly integrating social media, digital wallets, and app‑based discovery into nearly every step of the purchase journey. Importantly, Gen Z (born after 1997) is gliding into peak spending years; from 2019 to 2023, their aggregate spending rose by more than 50% according to the latest BLS data. We believe that these cohorts reinforce e‑commerce’s growth runway and support sustained, logistics‑intensive fulfillment models.
Consumer expectations for the speed and convenience of home delivery accelerated during the pandemic, and we believe this could remain sticky. One clear example is “bracketing,” where shoppers buy multiple sizes or styles (especially in apparel) and return what does not fit. With apparel consistently among the largest online categories, bracketing magnifies reverse‑logistics volumes. The National Retail Federation estimates U.S. consumers returned $901 billion of merchandise in 2024, with average return rates of 24.5% for e‑commerce versus 8.71% for in‑store purchases. High and uneven return flows can require dedicated nodes, specialized labor, and technology to triage, refurbish, and reroute inventory.
Why it matters for commercial real estate investment. The implications for industrial real estate are tangible. Returns processing, inventory decentralization, and last‑mile optimization each increase logistics intensity—more facilities, closer to end demand, with higher throughput requirements. Retailers are expanding dedicated return‑processing hubs and micro‑fulfillment nodes while re‑configuring networks toward dense, infill submarkets that compress delivery windows. Facilities with flexible footprints, robust power infrastructure, and sorting capability are particularly well positioned as omnichannel supply chains continue to mature.
Bottom line: in our view, e‑commerce is not a pandemic‑era anomaly; it is a durable demand driver that continues to outperform store‑based retail and reshape supply chains. We expect these dynamics to underpin resilient absorption and pricing power for well‑located, modern logistics assets—especially last‑mile and returns‑capable facilities—in the years ahead.
1 U.S. Census Bureau, Retail Indicators Branch. Estimated Quarterly U.S. Retail Sales (Adjusted): Total and E-commerce. Last revised: August 19, 2025.
2 Capital One Shopping Research. Online Shopping Trends. Last updated: June 17, 2025
3 Bureau of Labor Statistics, U.S. Department of Labor. April 18, 2025. The Economics Daily, Which Generation Spends More? https://www.bls.gov/opub/ted/2025/which-generation-spends-more.htm accessed on October 7, 2025.
4 Capital One Shopping Research. Online Shopping Trends. Last updated: June 17, 2025
5 U.S. Census Bureau, Retail Indicators Branch. Estimated Quarterly U.S. Retail Sales (Adjusted): Total and E-commerce. Last revised: August 19, 2025.
subscribe to our market outlooks and sector insights
Disclosures
This material is for educational purposes only and should not be treated as research. This material may not be distributed, transmitted or otherwise communicated to others, in whole or in part, without the express written consent of Bridge Investment Group Holdings LLC (together with its affiliates, “Bridge”).
The views and opinions expressed in this material are the views and opinions of the author(s) of the material. They do not necessarily reflect the views and opinions of Bridge and are subject to change at any time without notice. Further, Bridge and its affiliates may have positions (long or short) or engage in securities transactions that are not consistent with the information and views expressed in this material. There can be no assurance that an investment strategy will be successful. Historic market trends are not reliable indicators of actual future market behavior or future performance of any particular investment which may differ materially and should not be relied upon as such. Target allocations contained herein are subject to change. There is no assurance that the target allocations will be achieved, and actual allocations may be significantly different than that shown here.
This material does not constitute an offer of any service or product of Bridge. It is not an invitation by or on behalf of Bridge to any person to buy or sell any security or to adopt any investment strategy, and shall not form the basis of, nor may it accompany nor form part of, any right or contract to buy or sell any security or to adopt any investment strategy. Nothing herein should be taken as investment advice or a recommendation to enter into any transaction.
Hyperlinks to third-party websites in this material are provided for reader convenience only. Unless otherwise noted, information included herein is presented as of the dates indicated. This material is not complete, and the information contained herein may change at any time without notice. Bridge does not have any responsibility to update the material to account for such changes. Bridge has not made any representation or warranty, expressed or implied, with respect to fairness, correctness, accuracy, reasonableness, or completeness of any of the information contained herein, and expressly disclaims any responsibility or liability, therefore. The information contained herein is not intended to provide, and should not be relied upon for, accounting, legal or tax advice or investment recommendations. Investors should make an independent investigation of the information contained herein, including consulting their tax, legal, accounting or other advisors about such information. Bridge does not act for you and is not responsible for providing you with the protections afforded to its clients.
Certain information contained herein may be “forward-looking” in nature. Due to various risks and uncertainties, actual events or results may differ materially from those reflected or contemplated in such forward-looking information. As such, undue reliance should not be placed on such information. Forward-looking statements may be identified by the use of terminology including, but not limited to, “may”, “will”, “should”, “expect”, “anticipate”, “target”, “project”, “estimate”, “intend”, “continue” or “believe” or the negatives thereof or other variations thereon or comparable terminology. Any reference to indices, benchmarks, or other measure of relative market performance over a specified period of time are provided for context and for your information only.
All rights to the trademarks and/or logos presented herein belong to their respective owners and Bridge’s use hereof does not imply an affiliation with, or endorsement by, the owners of these logos. This material may contain select images that are provided for illustrative purposes only and may not be representative of assets owned or managed by Bridge. Such images may include digital renderings or stock photos rather than actual photos of assets, residents or communities.
Past performance is not necessarily indicative of future results.
Additional information may be available upon request.
© 2025 Bridge Investment Group Holdings LLC. All Rights Reserved.
GWMS,20251016-4907431-15457273